The US dollar has moved sharply lower from five-year trading high against the Japanese yen currency, as the mid-week sell-off in the greenback continues to gather downside momentum.
Most of the selling we are seeing is due to US dollar weakness, which has only been exacerbated by yesterday’s PPI inflation number, which came in much less than most analysts were expecting.
Furthermore, the latest report coming from Bank of Japan (BOJ) policymakers suggest that the central bank is now debating how soon they can start telegraphing an eventual interest rate hike.
This news is fairly seismic for the yen considering how long a zero-rate policy has been in place. Reports also suggest the hike could come even before inflation hits the bank’s 2% target.
The central bank of Japan is apparent becoming emboldened by broadening price rises and a more hawkish Federal Reserve. This will make the next BOJ policy meeting a real market mover if confirmed.
While an actual rate hike is hardly imminent and the BOJ is on course to maintain ultra-loose policy at least for the rest of this year, financial markets may be underestimating its readiness to gradually phase out its once-radical stimulus program.
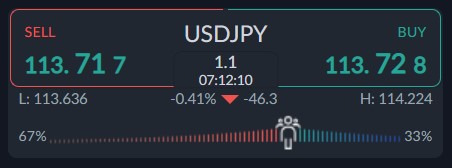
In terms of impact on the USDJPY pair. We should probably expect more yen strength. Even more so if the US dollar continues to go into meltdown mode. Personally, I think a test of the 112.00 support zone now looks plausible.
According to the ActivTrader Market Sentiment tool shows that some 67% of traders are bearish towards the USDJPY pair, which is not surprising, considering the huge reversal from the 116.00 handle.
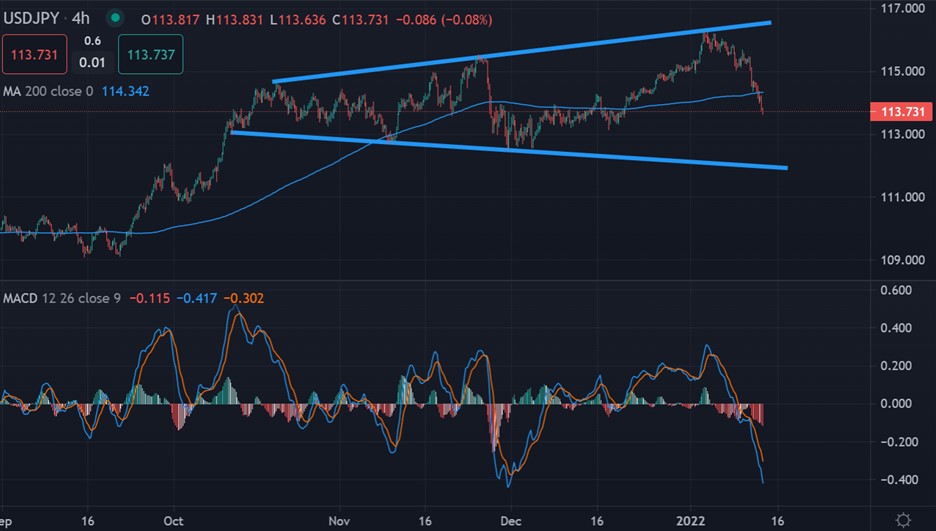
USDJPY Short-Term Technical Analysis
Technical analysis on the four-hour time frame shows that the USDJPY pair has staged a major reversal. According to the MACD indicator, significant amounts of bearish price divergence has been reversed around the 114.50 level now.
The USDJPY pair is also trading inside a large triangle type pattern. After failing at the top of the triangle it would seem bears are going to test towards the bottom of the channel, around the 112.00 level.
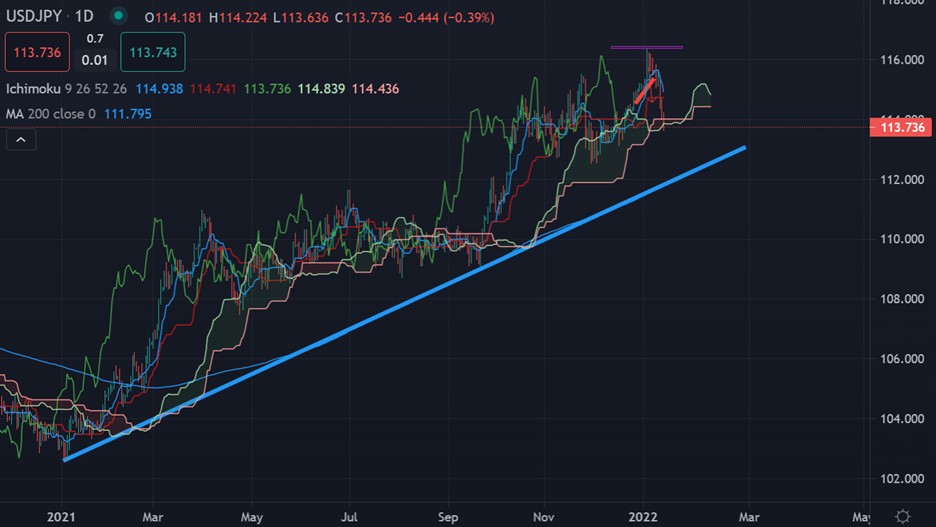
The daily time frame is showing that the USDJPY pair has broken to the downside and is now trying to test the Ichimoku cloud. Weakness under the Ichimoku cloud would mean a medium-term sell signal is now in place.
A very important multi-year trendline is also seen on the daily time frame. We could see an important test of the rising trendline, currently situated around the 112.00 support level.


