Tesla’s share price has broken under a large triangle pattern after Elon Mush sold a large swath of his shares, placing investor uncertainty towards the confidence the CEO has in Tesla.
The stock price of the largest electronic car maker had previously been trapped between the $1,000 and $1,800 level, following the recent stock market plunge, which saw Tesla’s share price tanking from $1,230 to $980.00.
With Elon Musk accelerating his disposal of Tesla Inc shares after last month’s Twitter poll, as he exercises more options. Musk, currently the world’s richest person, offloaded another 934,091 shares for about $906.5 million to cover taxes on the exercise of 2.1 million options.
The Tesla CEO has already sold almost 12 million shares since he pledged on Twitter to get rid of 10% of his Tesla stake — which would amount to about 17 million shares without taking into account his exercisable options.
Tesla traders could be saved by the FED later today, as the so-called dot plot, a gauge of the Fed’s outlook for interest rates could exceed current market expectations. That would provide the impetus for a recovery in stock price.
This is however a double-edged sword going into the FED meeting, as a more negative dot plot due to COVID-19 and Omicron fears, plus more QE tapering, could easily weigh heavily on Tesla’s share price.
Tesla Short-term Technical Analysis
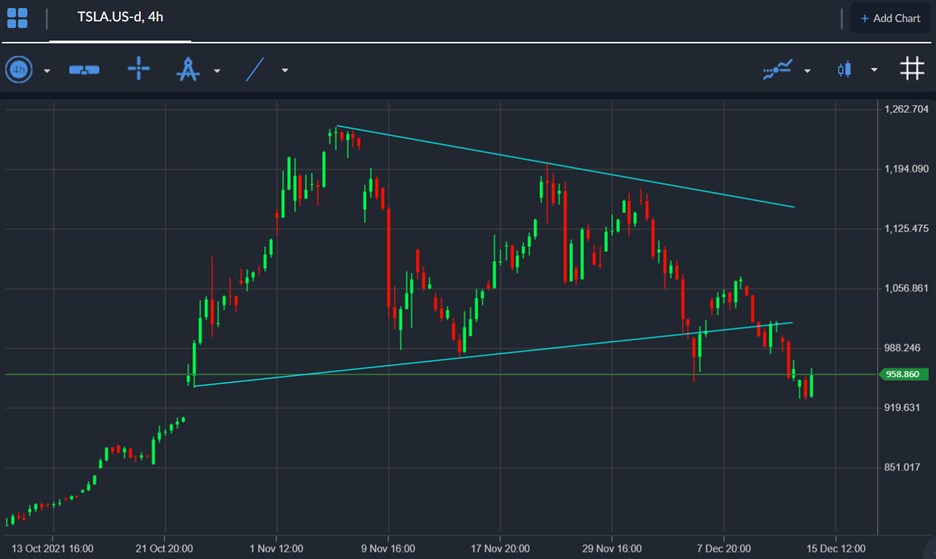
According to the four-hour time frame Tesla has broken under a large triangle pattern, which holds substantial downside potential if the current bearish breakout holds true.
Looking at the overall size of the bearish breakout from the triangle an initial move to $900.00 is likely, however, the overall projection would take Tesla’s share price to around $700.00.
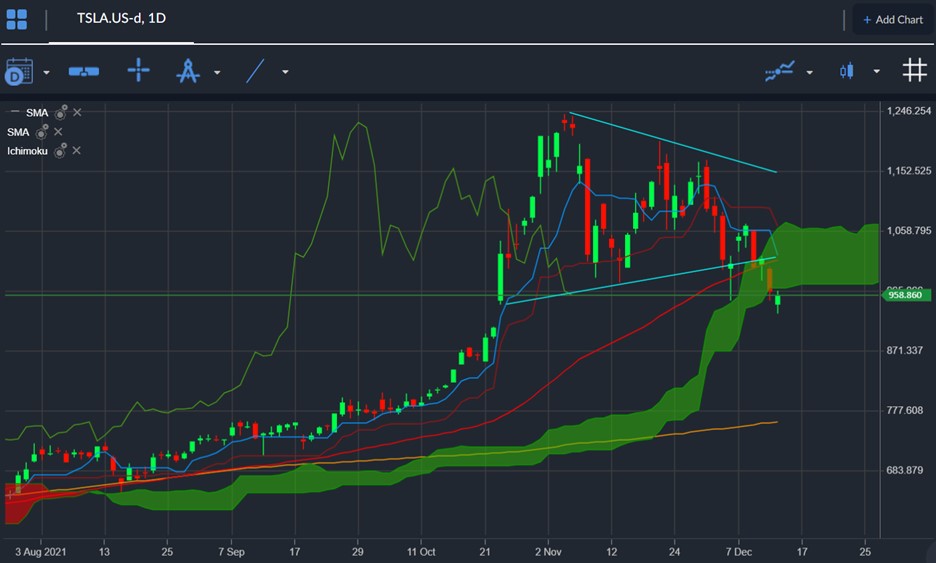
According to the daily time frame Tesla’s stock price has broken from a massive triangle and other negative technical factors, such as a break of the 50-day MA and Ichimoku cloud support are also weighing the medium-term technical.
The overall break is likely to accelerate if the $1,000 level is not reclaimed, and we could see a test of the 200-day moving average, close to the $750.00 level.


