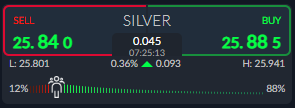
The price of silver has started to consolidate around its trend defining 200-day moving average as bulls fail to show up after last week’s massive sell-off from around the $28.00 level.
Gold is also in a similar predicament as the yellow metal lingers around the $1,1770 price area at the time of writing. Generally speaking, wherever the price of gold goes silver tends to follow.
What is apparent is that bulls remain in a state of disbelief towards the latest decline in the price of silver. Bullish sentiment towards the shiny metal is actually increasing while the price continues to dive.
Last week the ActivTrader Market Sentiment tool showed some 82 percent of trader held a bullish sentiment bias towards silver. The Market Sentiment tool now shows that 88 percent of traders bullish towards silver.
Typically, such a one-way sentiment skew should be considered a warning sign that a trend is starting. This is more often than not the case when traders are on the wrong side of the trade, which is exactly what is happening now.
Bulls need to be careful as a perfect long squeeze appears to be taking place. Silver’s rock-solid fundamentals have been unquestionable for some time. However, if the FED moves closer to tapering then silver’s fundamentals are at risk.
On the positive front, the CME futures chart has been showing for some time now that significant volume and interest for silver had been seen around the $26.00 level, so bulls got the retest they needed. This could be a make-or-break moment for silver as the metal consolidates around $26.00.
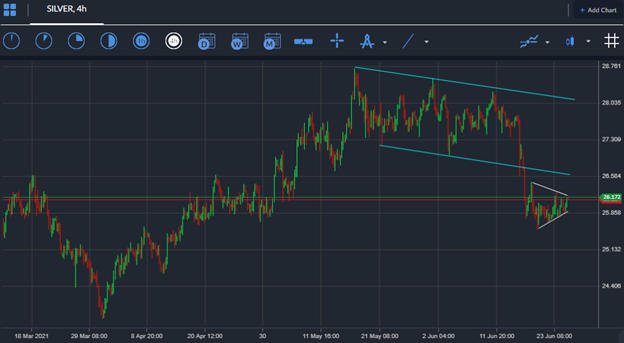
Silver short-term Technical Analysis
The short-term technicals for silver show that a huge bearish breakout from a falling price channel has taken place after silver crashed below the $28.00 support level last week.
According to the overall size of the falling price channel a decline of some $1.50 is likely to happen. This would take the price of silver towards the $25.50 technical region in the short-term.
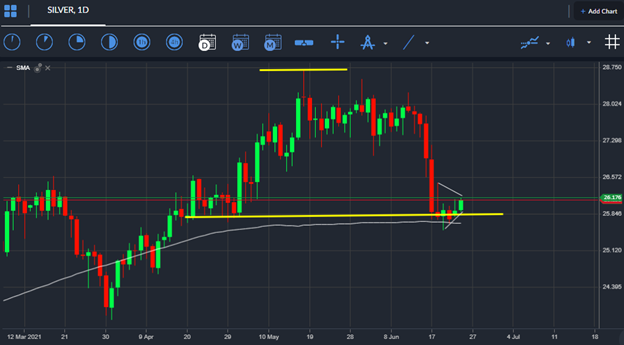
The daily time frame shows that the price of silver is testing a hugely important technical area for numerous reasons. Firstly, silver is testing its 200-day moving average, around $26.00.
Secondly, the $26.00 level is the neckline of a huge head and shoulders pattern. The pattern holds a downside projection of around $3.00, making this a key moment for silver.
Overall, watch out for a rebound towards the $29.00 over the coming weeks or a price collapse towards the $23.00.


