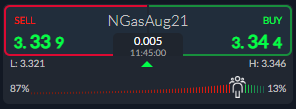
The price of Natural Gas hit a two-year trading high yesterday as extremely tight government supply of Natural Gas caused prices to advance past the $3.40 resistance level.
Traders and market veterans noted that this is very unusual for Natural Gas prices to be hitting new annual highs at this time of year as June is not usually a strong month from a seasonal perspective.
Natural Gas usually enjoys price ramp during the winter as heating is in strong demand. It is also noteworthy that two storms are currently raging in the Atlantic, which is also causing spikes in Natural cases. Weather experts noted a 10 to 20 percent of a cyclone forming over the next two-days.
At this juncture, the strong rally going on through the commodity space could also be a contributing factor to higher Natural Gas prices. The new infrastructure bill from the Biden administration is another possible bullish catalyst.
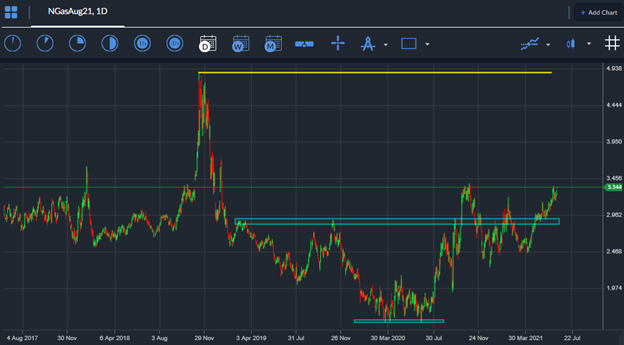
Looking at the technicals for Natural Gas, bullish patterns are forming, which is a generally an indication of further high prices. On an historical basis Natural Gas is a long way from the 2018 high, just under $5.00.
According to the ActivTrader platform some 87 percent of traders are bearish towards Natural Gas, meaning that only 13 percent of traders are bullish towards higher price.
With the sentiment bias still at extremely low level, I believe more losses remain possible, and we should expect the short squeeze in Natural Gas prices to continue.
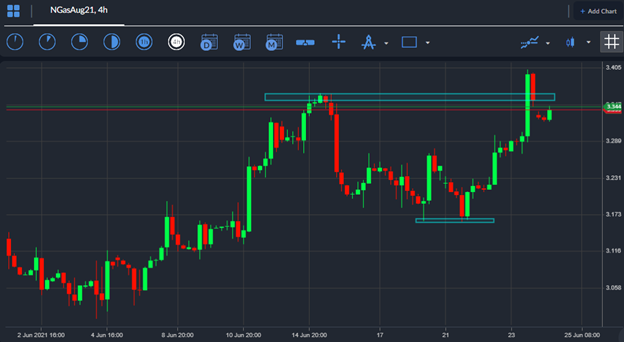
Natural Gas Short-term Technical Analysis
The four-hour time frame shows that a large, inverted head and shoulder pattern has formed, and is warning of more strong near-term gains for the price of Natural Gas.
According to the overall size of this typically bullish price pattern Natural Gas prices could be about to rally towards the $3.60 resistance level.
The larger picture for Natural Gas remains very bullish, and continues to show a even larger inverted head and shoulders pattern on the daily time frame, with the price the neckline of the pattern, around the $2.95 level.
According to the overall size of the bullish reversal pattern, copper prices could still hit the $5.00 level. Seeing as the pattern is in the process of playing out to the upside, shorts need to be very carefull.


