The Dow Jones Industrial Average has tumbled below the 35,000 level as fears over the Ukraine and Russia border crisis is causing the US and global stock markets to bleed lower on Friday.
Yields on US bonds fell during the Asian session, with the 10-year yield back to its lowest in a week after the brief pop higher earlier this week. This is a classic market risk-off coming back.
After the big drop in the US on Thursday equities continued lower here today. Regional stocks, such as Nikkei225 and Hang Seng fell. US equity index futures have dropped again, extending Thursday’s losses.
With the Dow Jones Industrial Average falling, bears have actually cracked the index’s 200-day moving average. If this continues it will be the first time the index has turned technically bearish since October 2020.
Big psychological numbers are closely watched by stock trading, meaning that the break of the 35,000 level is very important. With the break of the 200-DMA and the 35,000 level, the Dow Jones Industrial Average could easily fall towards the 32,000 level.
Certainly, it is possible given that the DJIA could crash further in a classic risk-off move, as the DJIA is well-known for staging daily moves of between 800 or even 1000 points when momentum starts to gather momentum on the bear side.
Additionally, historical sentiment data clearly shows that traders are extremely bullish towards DJIA as it starts to crash. This could be the smart money passing the bag to the retail crowd.
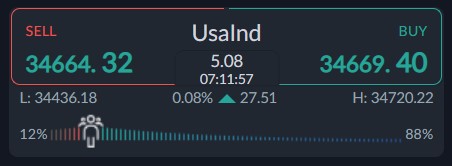
According the ActivTrader sentiment tool some 88 percent of traders were bullish towards the DJIA. This is a big red flag for further losses ahead.
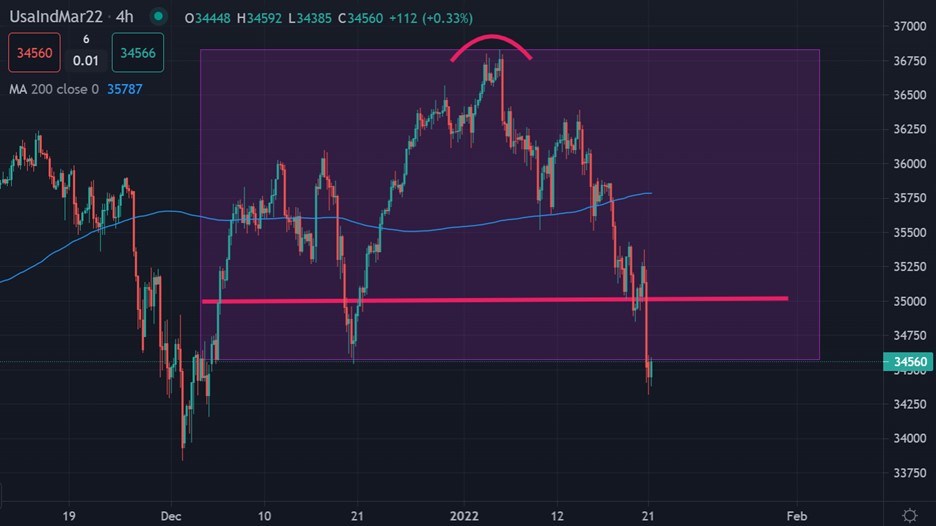
Dow Jones Industrial Average Short-Term Technical Analysis
The four-hour time frame shows that a head and shoulders pattern has officially been activated. These patterns are typically amongst the most bearish reversal patterns, so big downside moves can happen.
According to the size of the pattern, the overall bearish target could provoke a move towards the 37,200 level could take place, as the pattern holds an upside projection of around 2,000 points.
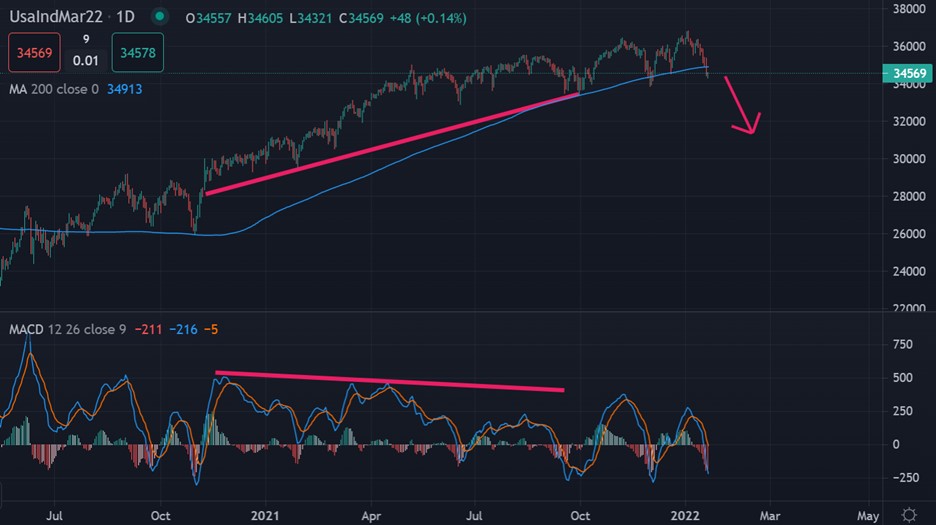
Dow Jones Industrial Average Medium-Term Technical Analysis
Looking at the daily time frame, the trend is now bearish, and the price has recently tumbled below the DJIA 200-day moving average, currently generating a big sell signal.
A large amount if negative price divergence is present from October 2020. Typically, we see these divergences reversed, and trigger massive bearish reversals.


