fbpx
High Leverage FX
  • Home
  • Market News
    • All
    • Economy
    • Forex
    • Markets
    • Opinion
    • Politics
    • Tech
    • World
    July starts with rising China manufacturing data and a strong dollar

    July starts with rising China manufacturing data and a strong dollar

    US and European equities sold-off amid lagging global growth anxieties

    Asian equities could trade lower as global stocks underperformed

    Copper Technical Analysis – Bearish Under $400.00

    Copper Technical Analysis – Bearish Under $400.00

    Global equities turn positive as FTSE100 breaks through resistance

    Global equities turn positive as FTSE100 breaks through resistance

    Asian equities could trade mixed as rising global bond yields and energy prices

    Asian equities could trade mixed as rising global bond yields and energy prices

  • Economic Calendar
  • About Us
  • Trading Signals
  • Free Demo Account
  • en English
    ar Arabiczh-CN Chinese (Simplified)zh-TW Chinese (Traditional)en Englishfr Frenchde Germanit Italianpt Portugueseru Russianes Spanishuk Ukrainian
High Leverage FX
No Result
View All Result
Home Market News Forex

USDCAD Technical Analysis – Pair holds below 1.3000 as investors gauge energy demand

Nathan Batchelor by Nathan Batchelor
May 18, 2022
in Forex
Reading Time: 3 min
0
USDCAD Technical Analysis – 1.2640 Huge Upcoming Resistance
450
SHARES
13.6k
VIEWS
Share on FacebookShare on Twitter

The USDCAD remained resilient holding above 1.2800 support as the dollar got a boost from Fed’s hawkish sentiment. Fed Chairman Powell indicated he is determined to bring down inflation in a bid to achieve price stability in the near term. The Fed is expecting to hike rates by 50bps in the next two policy meetings.

Investors are focusing on the US housing market data-Building permits and housing stats, although the impact is significantly low.

Crude oil inventories will be critical as investors gauge demand in the near term. USWTI was down -0.10% during the European session as the 115.55 area holds. The G-7 ministers will be meeting later today to discuss energy concerns as EU leaders struggle to replace the Russian oil supplies.

There will be a release of Canadian inflation data later in the New York session. The Canadian Core CPI (MoM) is expected to drop from 1% to 0.4% in April and Core CPI YoY by 0.1% to 5.4%.

See real-time quotes provided by our partner.

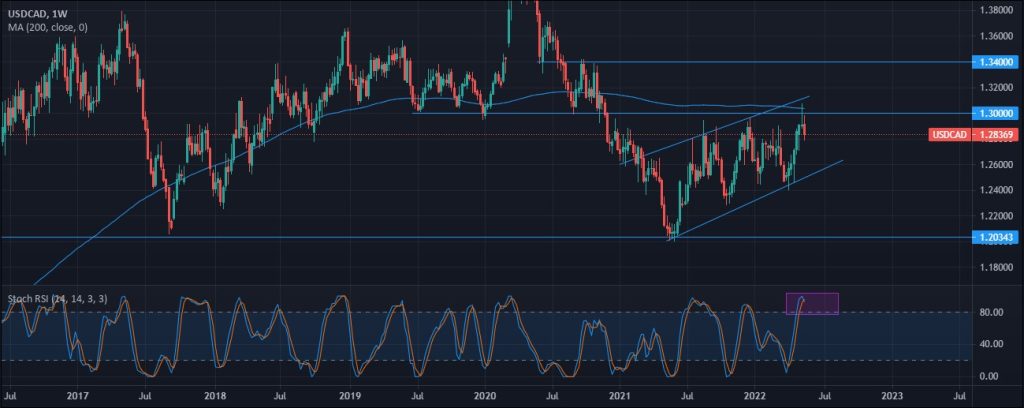
The USDCAD traded lower at the open of the week as commodity demand lifted as investors drew optimism from China easing lockdown measures. The weekly chart shows a rising channel indicating a bearish outlook for the pair in the near term. Bulls lost steam below the 1.3000 area and bears have a possibility to target the 1.2000, a 7-year low.

The Stochastic RSI is trading above the 80.00 reading showing an extreme overbought condition and the pair may have sharp retracements if the 1.3000 resistance holds.

However, a break above the 1.3000 which coincides with the 200-day moving average may attract bullish participation although upside gains are capped by the 1.3400 resistance.

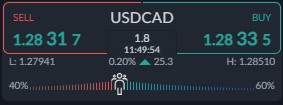
The ActivTrader Sentiment tool shows that retail traders have an increasing bullish sentiment over the USDCAD. A 63% of traders are long on the pair as hawkish sentiment over the Fed tightening peaks. However, the pair may trade lower as supply shocks continue to linger amidst the Ukraine/ Russia war cloud. The possibility of China easing lockdown measures may see commodity demand rise.

See real-time quotes provided by our partner.

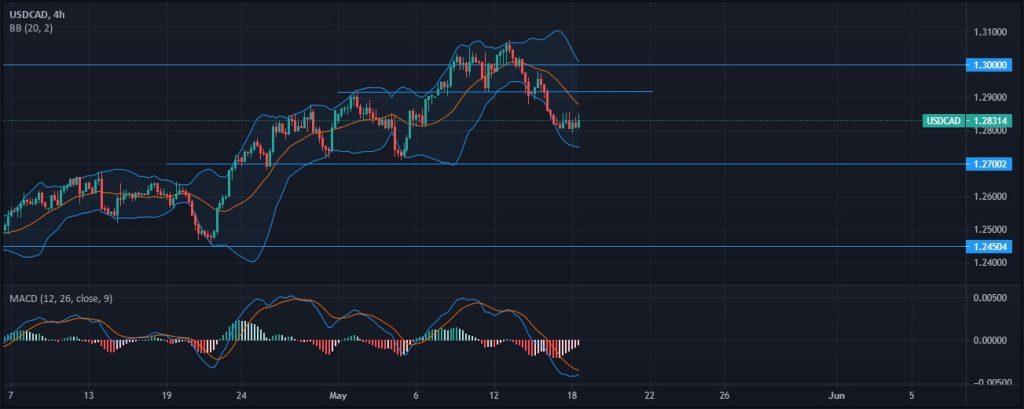
The USDCAD Bollinger Band (20) has a bearish breakout below the and the pair is trading towards a critical pivot at 1.27000. A break below that area may renew selling pressure on the pair towards the 1.24500 support, a January 2022 low.

The MACD indicator reading is showing diminishing selling volume while the moving averages are in negative territory. This indicates a possibility of a further drop if the indicator remains in the negative territory in the near- term.

However, upside gains are capped by the 1.2900 psychological figure, coinciding with the Bollinger bands baseline (yellow).

The commodity prices outlook will remain key to the strength of the Canadian dollar in the near term.

Tags: crude oilFEDinflationUSD/CAD
Previous Post

6 Getting An Adult Man To Ask You Out

Next Post

Lieber Charly, genau was muss ich ausführen wann ein Match {stoppt | verhindert | stoppt die Antwort?

Nathan Batchelor

Nathan Batchelor

Related Posts

USDMYR Technical Analysis
Forex

USDMYR Technical Analysis

June 28, 2022
USDCAD Technical Analysis – Loonie Could Be About To Rally
Forex

USDCAD Technical Analysis – 1.3000 Up Next

June 24, 2022
Dollar’s losing streak carried on into early Thursday trading
Forex

EURUSD Technical Analysis – Still Very Bearish

June 20, 2022
Strong gains for Pound versus both Dollar and Euro during early Monday trading
Forex

GBPUSD Technical Analysis – 1.1500 Now Possible

June 17, 2022
Gold Technical Analysis – Breakdown Below $1,790
Forex

Gold Technical Analysis – Breakdown Below $1,790

June 17, 2022
USDJPY Technical Analysis – 112.50 Key Resistance Level
Forex

USDJPY Technical Analysis – How Low Can The Yen Go?

June 15, 2022
Next Post

Lieber Charly, genau was muss ich ausführen wann ein Match {stoppt | verhindert | stoppt die Antwort?

Leave a Reply Cancel reply

Your email address will not be published. Required fields are marked *


Market Overview

July starts with rising China manufacturing data and a strong dollar

July starts with rising China manufacturing data and a strong dollar

by Neville Hornsey
July 1, 2022
0

Market Brief Caixin China's general manufacturing PMI jumped to 51.7 in June, up 3.6 points from the previous...

Categories

  • Economy
  • Forex
  • Gadget
  • Markets
  • Opinion
  • Politics
  • RSS Feed
  • Startup
  • Tech
  • Trading Signals
  • Uncategorized
  • World

Site Navigation

  • Home
  • Market News
  • Economic Calendar
  • About Us
  • Trading Signals
  • Free Demo Account
High Leverage FX

We aim to bring you the most update and actionable information so that you can trade the financial markets with confidence and security

We are social

  • Home
  • Market News
  • Economic Calendar
  • About Us
  • Trading Signals
  • Free Demo Account

© 2019 High Leverage FX - All Rights Reserved.

No Result
View All Result
  • Home
  • Market News
    • Forex
    • Economy
    • Opinion
    • World
    • Markets
    • Politics
  • Economic Calendar
  • Trading Signals
  • About Us
  • Free Demo Account
en English
ar Arabiczh-CN Chinese (Simplified)zh-TW Chinese (Traditional)en Englishfr Frenchde Germanit Italianpt Portugueseru Russianes Spanishuk Ukrainian

© 2019 High Leverage FX - All Rights Reserved.

Please share your location to continue