fbpx
High Leverage FX
  • Home
  • Market News
    • All
    • Economy
    • Forex
    • Markets
    • Opinion
    • Politics
    • Tech
    • World
    Asian equities could take a boost after strong gains seen on US equities

    Asian equities may trade on the back foot as traders took profits during Wall Street session

    USDMYR Technical Analysis

    USDMYR Technical Analysis

    Asian equities observe positive start as optimism on Wall Street echoes

    Asian equities could trade with negative bias reflecting caution awaiting Nvidia’s earnings report

    Asian equities could take a boost after strong gains seen on US equities

    Asian equities likely to trade within narrow range following volatile session on Wall Street

    Asian markets may experience volatility as global participants eagerly await significant upcoming events

    Asian markets may experience volatility as global participants eagerly await significant upcoming events

  • Economic Calendar
  • About Us
  • Trading Signals
  • Free Demo Account
High Leverage FX
No Result
View All Result
Home Market News Tech

US100 Technical Analysis – Divergence points to 12,000

Nathan Batchelor by Nathan Batchelor
January 27, 2022
in Tech
Reading Time: 3 mins read
0
US100 Technical Analysis – Divergence points to 12,000
347
SHARES
10.6k
VIEWS
Share on FacebookShare on Twitter

The Nasdaq has currently eroded all of its weekly gains, and chances of a meaningful recovery after the Federal Reserve signalled that it would begin raising interest rates during the January policy meeting.

Bears are currently hammering US stocks right now. European are heading lower, but certainly not to the degree that the US is seeing, which clearly hints that a taper tantrum is happening.

Financial markets have shifted violently from bullish to bearish in recent weeks as investors are facing the reality of the FED’s stance, and the effects of an impending rate rising cycle by the US central bank as it aims to tame soaring inflation.

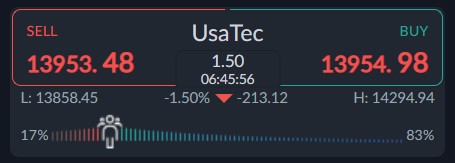
Interestingly, the Nasdaq is at real risk of moving into a bear market, after eroding all of its weekly gains and breaking under some very meaningful technical levels on the way to 13,900.

The Nasdaq has now moved under its 200-day moving average for the first time since the entire bull run, which started in mid-2020. Even more worryingly, the Nasdaq is now under its 50-week moving average.

A breach under the 50-week is very bearish. And usually signals that a coming test of the 100-week or even the 200-week could be pending. The 100-week is currently found around the 12,000 level.

The ActivTrader market sentiment tool is showing that some 83 percent of traders are bullish towards the US dollar index. Not a good sign. This probably shows that the retail crowd is buying, despite the trend change.

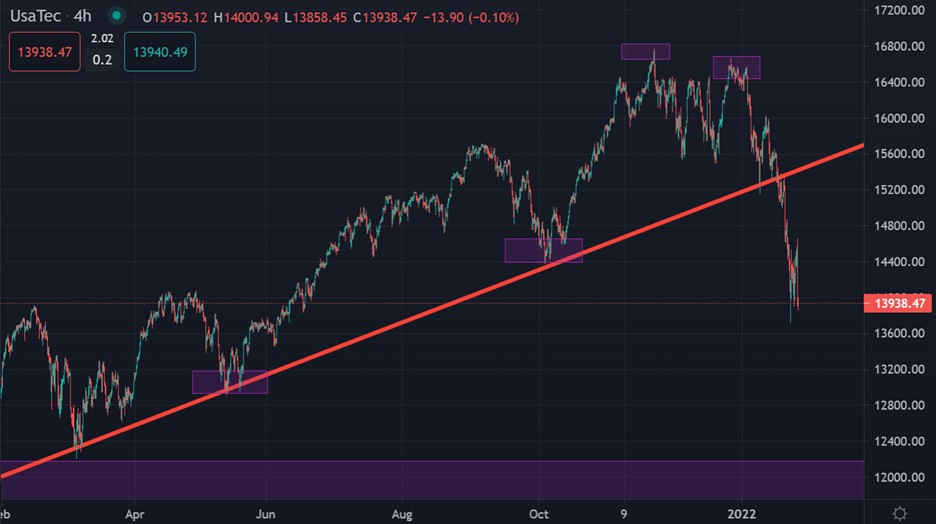
US100 Short-term Technical Analysis

Looking at the four-hour time frame, the technicals show that the Nasdaq has broken key trendline support and has started to make bearish lower lows and indeed bearish lower highs.

Typically, when a meaningful low is breached, the market then heads to the next significant low, which is found around 13,000, one thousand points lower. Technical analysis also shows that a bearish double-top pattern has formed.

See real-time quotes provided by our partner.

US100 Medium-term Technical Analysis

The medium-term picture for the Nasdaq now looks to be very bullish to me, and if bears can continue to heap on the pressure, we could be looking at 1,000 to 2,000 points lower, quickly.

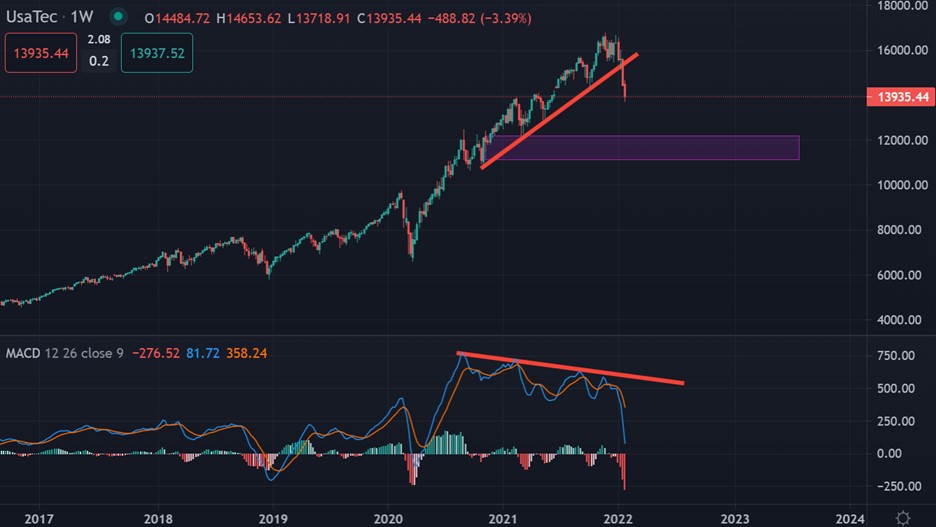
Looking at the weekly time frame, huge amounts of negative MACD price divergence is found around the 12,000 and 10,000 level. For me, the 12,000 level looks highly probable to me.

See real-time quotes provided by our partner.

Tags: FEDNasdaq
Previous Post

Asia equities trading positive after volatile lead from Wall Street

Next Post

EURUSD Technical Analysis - Euro is breaking down

Nathan Batchelor

Nathan Batchelor

Related Posts

Nasdaq Technical Analysis – Wedge Watch
Tech

US100 Technical Analysis – 1,400 Incoming

May 25, 2023
Market Insight – Apple Earnings
Tech

Market Insight – Apple Earnings

May 5, 2023
US100 Technical Analysis – Troubled below 13,800
Tech

Nasdaq Technical Analysis – 12,200 Incoming?

February 9, 2023
Tesla is a $1 trillion company again
Tech

Tesla Technical Analysis – Testing towards $180.00

January 25, 2023
Tesla Technical Analysis – Sinking towards $100.00
Tech

Tesla Technical Analysis – Sinking towards $100.00

January 4, 2023
US100 Technical Analysis – Troubled below 13,800
Tech

Nasdaq Technical Analysis – 9,000 Incoming?

November 7, 2022
Next Post
EURUSD Technical Analysis – Euro is breaking down

EURUSD Technical Analysis - Euro is breaking down

Leave a Reply Cancel reply

Your email address will not be published. Required fields are marked *


Market Overview

Categories

  • Economy
  • Forex
  • Gadget
  • Markets
  • Opinion
  • Politics
  • RSS Feed
  • Startup
  • Tech
  • Trading Signals
  • Uncategorized
  • World

Site Navigation

  • Home
  • Market News
  • Economic Calendar
  • About Us
  • Trading Signals
  • Free Demo Account
  • Home
  • Market News
  • Economic Calendar
  • About Us
  • Trading Signals
  • Free Demo Account

© 2019 High Leverage FX - All Rights Reserved.

No Result
View All Result
  • Home
  • Market News
    • Forex
    • Economy
    • Opinion
    • World
    • Markets
    • Politics
  • Economic Calendar
  • Trading Signals
  • About Us
  • Free Demo Account
[gtranslate]

© 2019 High Leverage FX - All Rights Reserved.