The US dollar index closed the monthly candle heavily in the red, marking the second consecutive month of losses for the index, as last week’s rally in the greenback was quickly reversed as technical sellers stepped back into the market.
Bulls failed to sustain the attack, despite Core PCE in the United States having its largest month increase in nearly three decades. The news that the Biden administration is considering expanding its fiscal budget to $6 trillion also started to weigh on the US dollar index.
At present, the fundamentals, technicals, and sentiment metrics are aligning, and weighing on the US dollar index, with the ongoing bear market in the US dollar index looking extremely likely to extend well into this and next quarter.
The technicals surrounding the US dollar index show that a bearish death cross is in place, while the US dollar index is not yet oversold according to the daily and week RSI indicator readings. The US dollar index is also trading below all key daily, weekly and monthly moving averages.
Technical traders will probably be looking to two key price levels this month. The current yearly low, at 89.20 and the 2018 trading low, around the 88.25 level are set to be a big focus this month. If both of these levels are broken with conviction then the US dollar index is likely to go into meltdown mode.
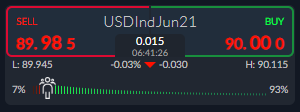
Looking at market sentiment, the ActivTrader Market Sentiment tool shows that some 93 percent of traders are bullish towards the US dollar index. This one-way sentiment skew has increased by over ten percent since last week and provides a worrying realization that most retail traders are bullish towards the buck.
With sentiment metrics this bullish and indeed skewed in one direction, I believe that another major leg lower is going to take place over the coming days and weeks. Traders should be braced for big rallies in EURUSD, GBPUSD, and the antipodean currencies if this comes to pass.
US Dollar Index Short-Term Technical Analysis
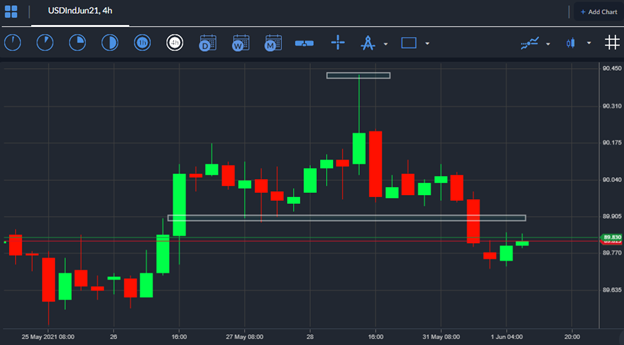
According to the four-hour time frame a small bearish head and shoulders pattern is looming over the US dollar and is issuing a warning sign that a 50-point drop is about to take place.
Bears need to move the price below the 89.00 level to activate this bearish price pattern across the lower time frames. If the price moves above the 90.45 level then the pattern will be invalidated, and a rally towards the 91.00 handle will probably take place.
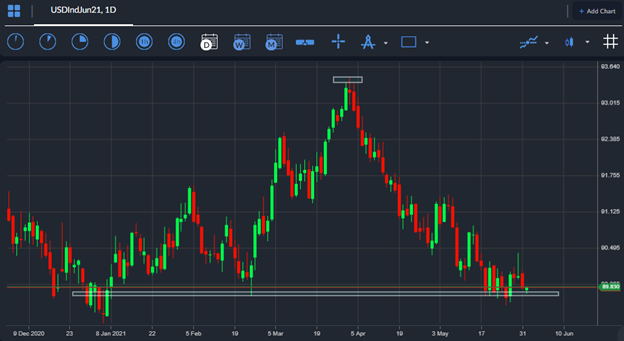
Looking at the daily time chart a massive complex head and shoulders pattern looks to be forming, with the US dollar index appearing to be close to a major technical meltdown towards the 86.50 price area. Watch out for the index to tumble this month if the price holds under the 89.80 support level on a sustained basis this week.
According to the overall size of the pattern a bearish decline of 330 points is likely to take place, which is likely to translate into massive gains for the EURUSD, GBPUSD, AUDUSD, and NZDUSD pairs.


