The US dollar index hit its highest trading level since July 2020 yesterday, following the sudden announcement that incumbent FED Chair Powell was going to be voted into office over Loretta Brainard.
US dollar bulls cheered the news as it was very much a status quo trade, meaning more cautious tapering and potential rate hikes ahead for the greenback into Powell’s second term, assuming COVID-19 and economic problems do not revisit the US economy.
With the US dollar in breakout mode, and rapidly rising above the 96.00 handle, the next big question is where does the US dollar index head next. Fibonacci analysis could have an answer.
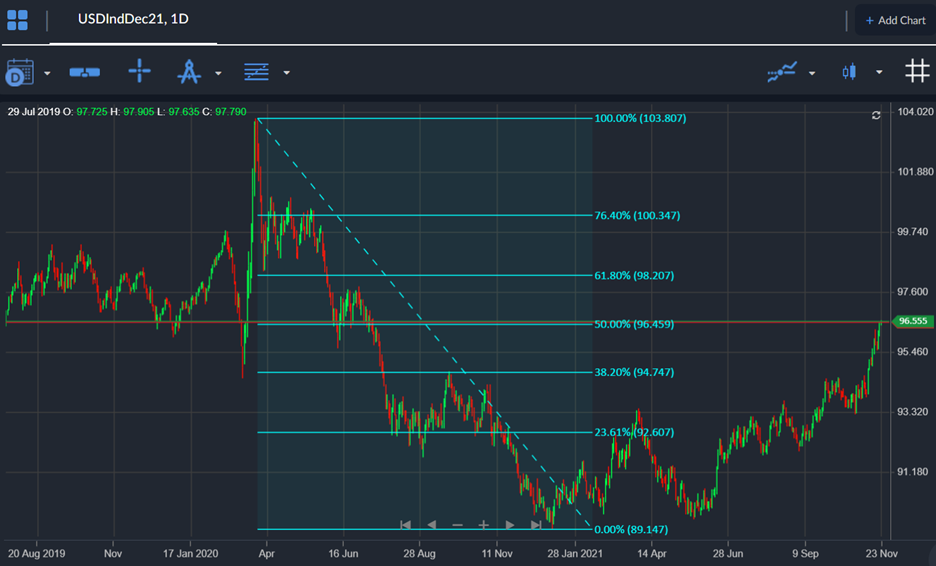
According to Fibonacci analysis, which many traders look, the 61.8 fib retracement sequence of the 2021 low to the 2020 high currently comes in around the 98.20 resistance level.
This could be a major bullish target if the upsurge continues, and potential swing area for bears, making it a compelling trade to watch on the foreign exchange market this week.
Many banks have come up and downgraded euro forecasts, and even suggested that the US dollar is overvalued at current levels. With this in mind, selling an overextended dollar may not be a bad strategy.
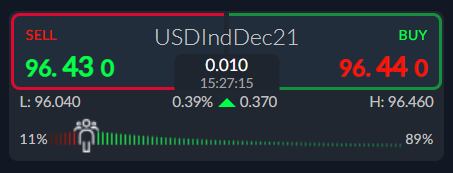
The ActivTrader market sentiment tool is showing that some 89 percent of traders are bullish towards the US dollar index. This is bad for bulls as typically such overstretched sentiment from the retail crowd usually hints that a big price reversal could be on the horizon.
US Dollar Index short-term Technical Analysis
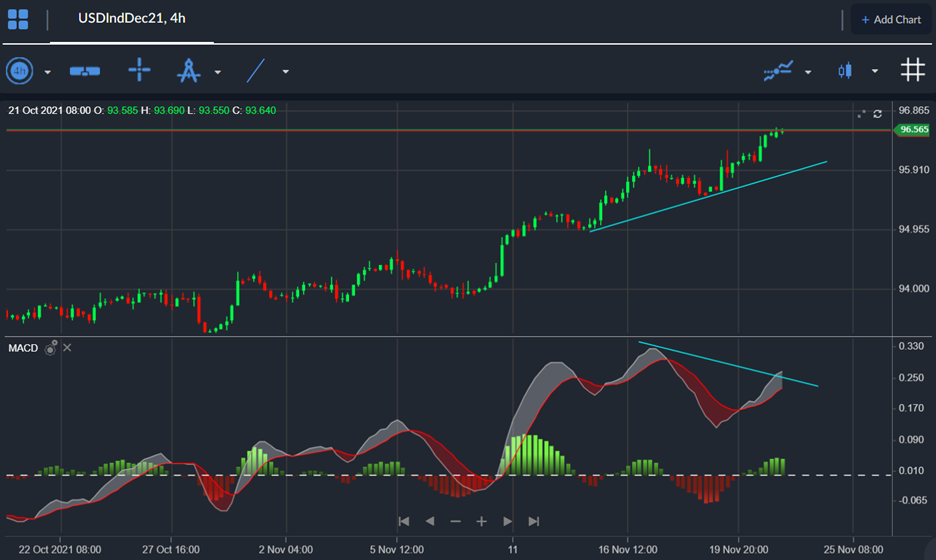
Looking at the four-hour time frame, the technicals look overstretched, with the US dollar index officially reaching the target a large, inverted head and shoulders pattern, which is a bullish reversal pattern.
According to technical analysis a substantial amount of negative price divergence is seen until the 95.00 handle, so do be mindful of pullback around current levels.
The medium-term picture for the US dollar index looks to be very bullish above the 94.70 level looking on the weekly and daily time frame. This is formerly the top end of the multi-year price range for the greenback.
Fibonacci analysis shows that the 50 percent fib retracement sequence of the 2021 low to the 2020 high has been surpassed, currently placing the 61.8 Fib level as the next primary bullish target and potential swing zone around the 98.20 resistance level.


