The FTSE 100 has broken above the top-end of its trading range, further hinting that the leading UK index could be preparing to follow other European indices and head towards a new all-time high this year.
Bulls still have much work to do to pierce the current all-time high, around the 7,900-resistance level, however, it is certainly plausible given that US stocks are at record highs, and the DAX, ITA40, and CAC40 are at record highs.
Possible catalysts for the FTSE100 to push higher this week include mining and housebuilding stocks. Mining stocks inside may get a boost from the price of gold crossing $1,800.
Other commodities rising in price due the US infrastructure bill is also likely to beneficial for miners, who have recently suffered from inflation as energy and machinery costs have skyrocketed this year.
UK housebuilders also benefitted after the Bank of England’s declined to move to a higher rate path this year during last week’s policy meeting. UK housebuilding stocks are therefore enjoying positive momentum, and thus building relating stocks are set to go higher this week.
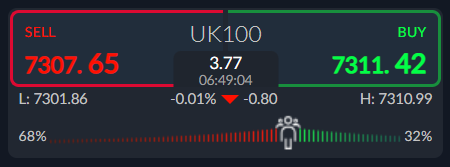
Sentiment towards the UK100 is also looking good for bulls and has drop considerably since last week. According to the ActivTrader platform some 68 percent of traders are bearish towards the UK100.
This could be extremely bullish for the UK100, given that retail traders tend to lean against the overall trend, and are known to run counter to the prevailing market trend.
UK100 Short-Term Technical Analysis
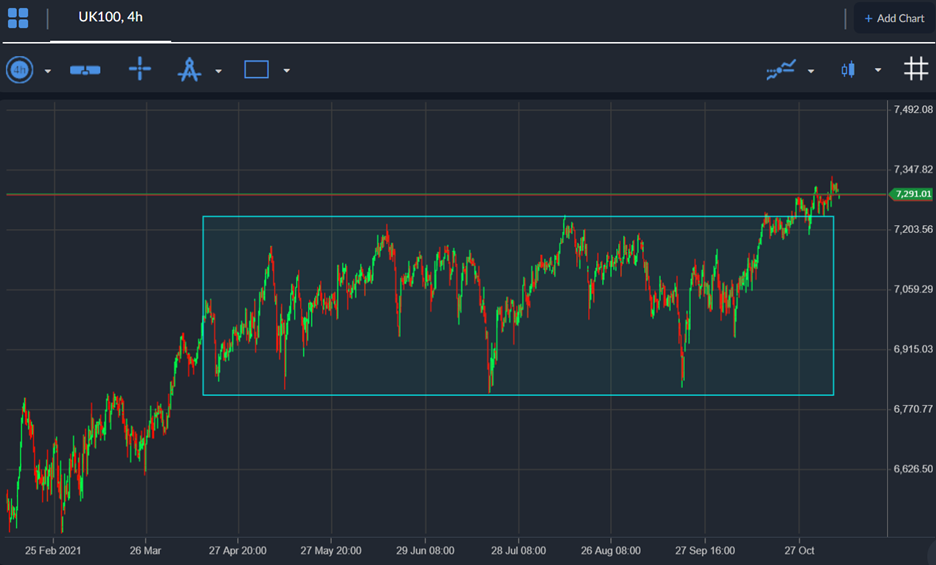
The four-hour time frame shows that the FTSE100 ignited a large, inverted head and shoulders pattern after buyers successfully broke through the 7,250-resistance level last week
It should be noted that this now activated pattern holds a massive 300 points of upside potential if activated, which would take the FTSE100 towards the 7,500-resistance area.
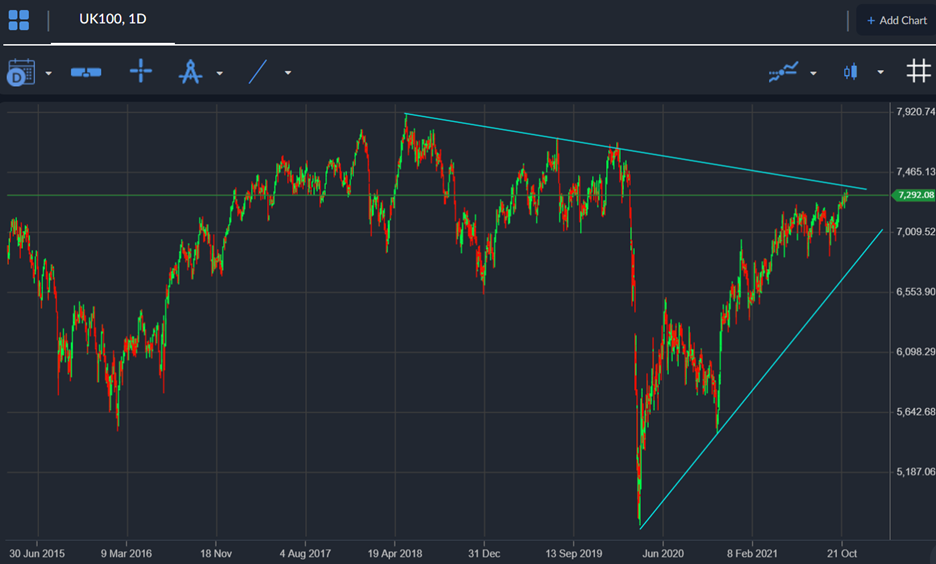
The daily time frame shows that the UK100 is approaching an extremely important trendline on the daily chart, which basically is the final line of resistance between the UK100 and its all-time high.
A break towards the 7,400 level could turbo charge the FTSE100 towards the 7,900 level, however, failure here and the index could pull back sharply and test the 7,200 level one final time.


