The FTSE100 has started to pullback towards the 7,600 level as buying interest starts to dry up after last week’s breakout rally to new highs amidst optimism over fewer US rate hikes.
Investors are somewhat downbeat, following a strong US service sector print from the Institute for Supply Management on Monday. The ISM services index rose to 56.5% last month.
The ISM print caused investors to worry that the Federal Reserve may not yet take its foot off the monetary policy tightening pedal. Previously, following recent remarks by US Fed Chair Jerome Powell, the market had been starting to count on a 0.50% hike.
Major investment bank, Deutsche Bank noted that the strong ISM survey reading added to positive economic signals from the US nonfarm payrolls report on Friday. Markets now are ‘skeptical that the Fed would be easing off any time soon with numbers like these’.
UK stocks typically follow US stock markets, so a pullback in UK stocks is also generally bearish for UK stocks. Additionally, UK stocks looked somewhat overbought from last week, so a correction looks due.
It is also noteworthy that the technical picture looks to be short-term bearish and medium-term bullish. More on this later as we now move towards current sentiment metrics.
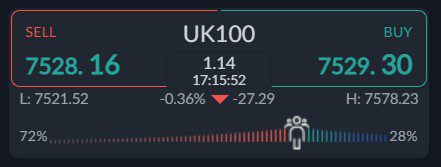
Sentiment remains very bearish, which could be great for further price gains ahead for the UK100. With retail looking to short we could see the FTSE100 holding above the 7,500 level.
If we look at the ActivTrader Market Sentiment tool, 72 percent of traders are currently bearish. This metric has dropped 8 percent last week. However, more losses are likely.
Based on the current sentiment reading I think it is highly probable that we could see the upside starting to accelerate.
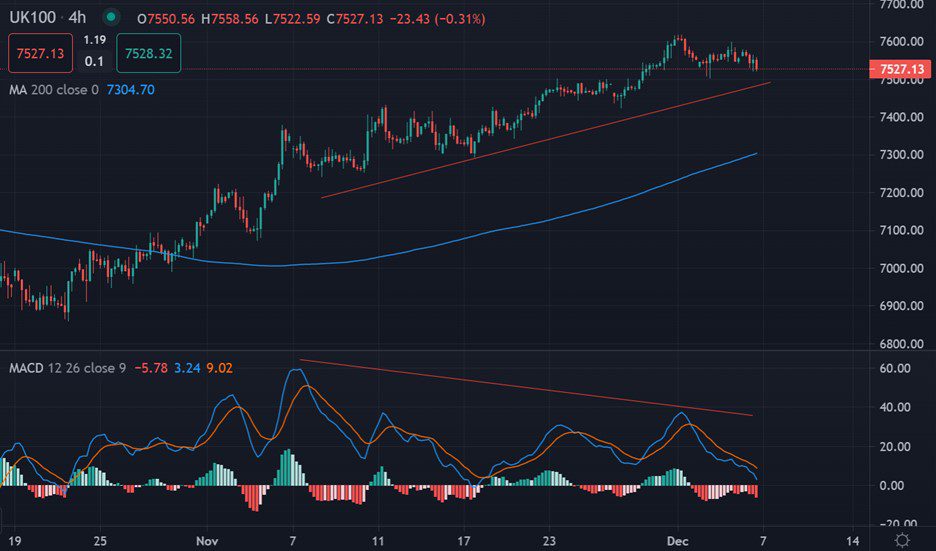
UK100 Short-Term Technical Analysis
According to the four-hour time frame the UK100 has formed huge amount of negative MACD price divergence and could be about to drop sharply.
The size of the negative divergence points to a pending drop towards the 7,200 area. I would suggest keeping a close watch on the 7,500 level for incoming losses.
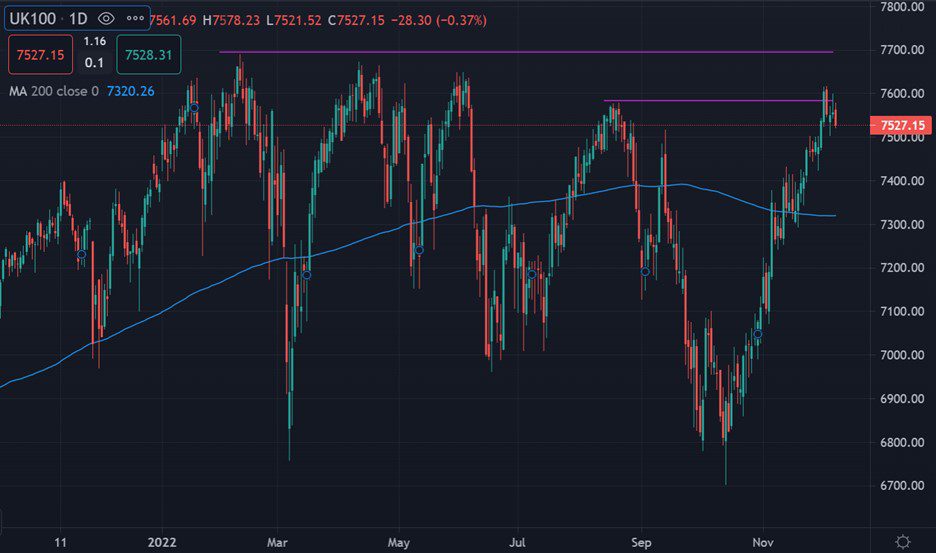
The daily time frame shows that the UK100 is edging back towards the top of its price range, and a move towards the 7,600 level would help form a huge inverse head and shoulders pattern.
If we see the UK100 starting to move towards the 7,700 to 7,800 area, then the all-time is within touching distance. All eyes will be on a huge break above this year soon.


