The FTSE 100 has started to move back from the 7,400-resistance level, as the index gives back its recent strong gains after breaking out from the top-end of its yearly trading range.
Alongside other European indices, the UK100 has been on a solid run higher in recent weeks, and many stocks inside the largest UK index have reacted very positively to a strong third-quarter earnings season.
Investors have also started pricing in earlier and earlier rate hikes, in response to higher inflation signals, despite the Bank of England pouring cold water on an imminent rate hike in the October policy meeting.
For intents and purposes, investors and traders of the UK100 index are battling two opposing forces at the moment. Earnings optimism and inflation jitters are causing subdued price action, despite the positive range breakout.
This week’s CPI jobs report from the UK showed that inflation hit a 10-year high. Essentially, this is why traders view the Bank of England’s rate path this year as being only higher.
The strong number could spook UK housebuilding stocks, which are also sensitive to rate increases. On the flip side, raising rates could propel banking stocks higher, as rate hikes are generally bullish for banks.
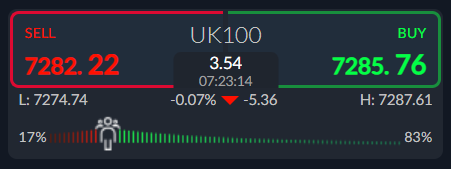
Sentiment towards the UK100 is also in favour of more losses as traders remain overwhelmingly bullish. According to the ActivTrader platform some 83 percent of traders are bullish towards the UK100.
Retail traders tend to lean against the overall trend, so with the short and medium-term trend is bullish for the UK100, is also a good sign. However, given the 130-point pullback, a healthy dose of scepticism is probably needed.
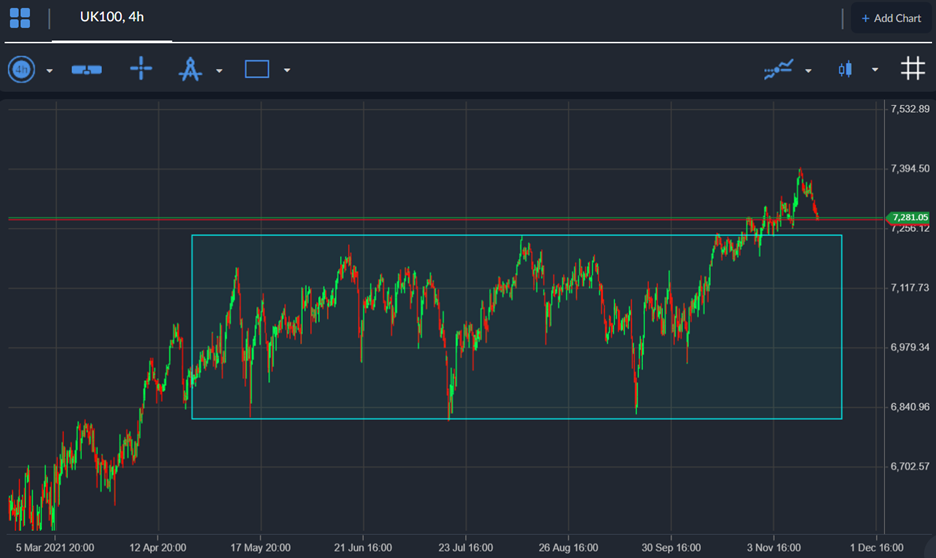
UK100 Short-Term Technical Analysis
The four-hour time frame shows that the FTSE100 has shown that bulls have ignited a large, inverted head and shoulders pattern intact as buyers broke through the 7,200-resistance level.
It should be noted that this pattern holds a massive 300 points of upside potential if activated, which would take the FTSE100 towards the 7,500-resistance area. This means more upsides could probably be expected as the target of the pattern has not yet been reached.
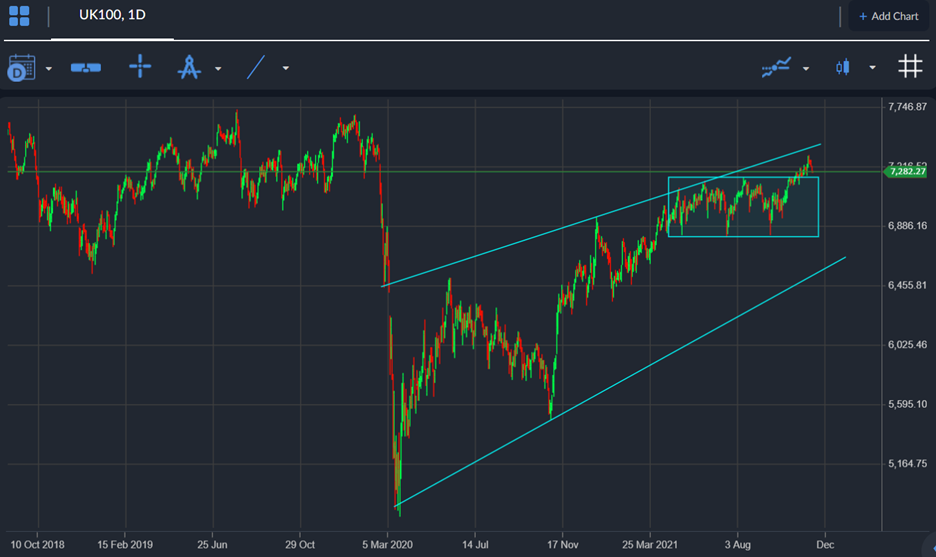
The daily time frame shows that the UK100 remains trading inside a large rising price channel, with the price now close to the top of the pattern, rather than the bottom of the pattern.
A move towards the 7,500 level could be on the horizon medium-term if bulls can hold the price above the 7,200 area during this latest decline As the pattern is rising, the index could eventually top out around the 7,550 area.


