fbpx
High Leverage FX
  • Home
  • Market News
    • All
    • Economy
    • Forex
    • Markets
    • Opinion
    • Politics
    • Tech
    • World
    Asian equities could take a boost after strong gains seen on US equities

    Asian equities may trade on the back foot as traders took profits during Wall Street session

    USDMYR Technical Analysis

    USDMYR Technical Analysis

    Asian equities observe positive start as optimism on Wall Street echoes

    Asian equities could trade with negative bias reflecting caution awaiting Nvidia’s earnings report

    Asian equities could take a boost after strong gains seen on US equities

    Asian equities likely to trade within narrow range following volatile session on Wall Street

    Asian markets may experience volatility as global participants eagerly await significant upcoming events

    Asian markets may experience volatility as global participants eagerly await significant upcoming events

  • Economic Calendar
  • About Us
  • Trading Signals
  • Free Demo Account
High Leverage FX
No Result
View All Result
Home Market News Tech

Tesla Technical Analysis – Testing towards $180.00

Nathan Batchelor by Nathan Batchelor
January 25, 2023
in Tech
Reading Time: 2 mins read
0
Tesla is a $1 trillion company again

Photo by Tesla Fans Schweiz on Unsplash.

474
SHARES
17.2k
VIEWS
Share on FacebookShare on Twitter

Tesla’s share price has been rallying this week as the electric automobile maker benefitted from a run higher in tech stocks, as its value moved away from $100.00 per share.

Many of the technical signs are very good for Tesla now. The charts show a huge amount of bullish MACD divergence. Plus, tech stocks looked to have formed a major price bottom.

It is noteworthy that Tesla is expected to report results for the December quarter of 2022 on January 25th. Investors should expect disappointment as compared to current analyst estimates.

For Q4, Tesla delivered ‘only’ about 405,000 cars, which is almost 35,000 lower than what the company produced. With discounts for Tesla’s best-selling Model 3 being as high as 15%, it is unlikely that Tesla will maintain a 15% EBIT margin.

I would also argue that Tesla’s stock is completely oversold. The RSI indicator is at its lowest ever lower on the daily and weekly time frame leaving tremendous scope for a price bounce.

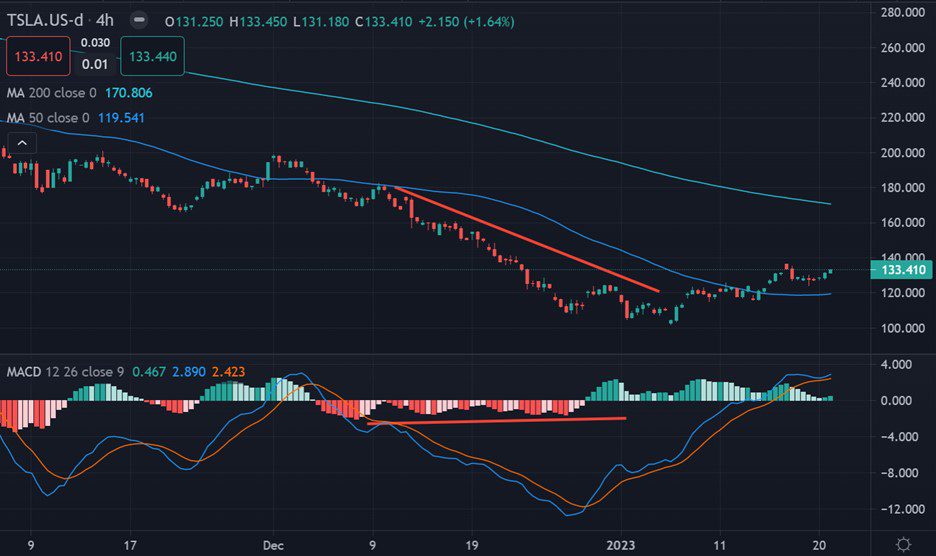
Tesla Short-term Technical Analysis

According to the four-hour time frame, Tesla’s stock price has started to ignite a large, inverted head and shoulders. Looking at the size of the pattern  I would suggest an $80.00 price move is likely.

Due to the presence of a bullish MACD price divergence an explosive reversal move is surely brewing for the car company and buying towards $180.00 is likely.

See real-time quotes provided by our partner.

Tesla Medium-term Technical Analysis

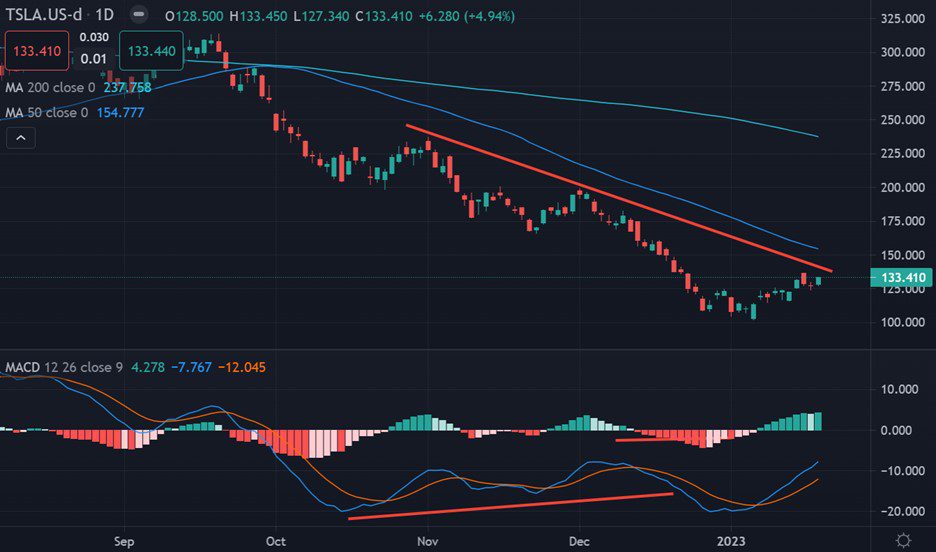
According to the daily time frame Tesla’s stock price has ignited an inverted head and shoulders pattern. These types of patterns are very bullish, however, it does suggest a huge upward price move is coming.

The larger picture still shows bullish MACD price divergence extending towards the $250.00 area The $160.00 level is Tesla’s 200-day moving average.

See real-time quotes provided by our partner.

Tags: NasdaqTesla
Previous Post

The Week Ahead

Next Post

Morning Brief - European traders await PMI’s

Nathan Batchelor

Nathan Batchelor

Related Posts

Nasdaq Technical Analysis – Wedge Watch
Tech

US100 Technical Analysis – 1,400 Incoming

May 25, 2023
Market Insight – Apple Earnings
Tech

Market Insight – Apple Earnings

May 5, 2023
US100 Technical Analysis – Troubled below 13,800
Tech

Nasdaq Technical Analysis – 12,200 Incoming?

February 9, 2023
Tesla Technical Analysis – Sinking towards $100.00
Tech

Tesla Technical Analysis – Sinking towards $100.00

January 4, 2023
US100 Technical Analysis – Troubled below 13,800
Tech

Nasdaq Technical Analysis – 9,000 Incoming?

November 7, 2022
Nasdaq Technical Analysis-10,000 Is Still Possible
Tech

Nasdaq Technical Analysis-10,000 Is Still Possible

September 16, 2022
Next Post
Morning Brief – European traders await PMI’s

Morning Brief - European traders await PMI’s

Leave a Reply Cancel reply

Your email address will not be published. Required fields are marked *


Market Overview

Categories

  • Economy
  • Forex
  • Gadget
  • Markets
  • Opinion
  • Politics
  • RSS Feed
  • Startup
  • Tech
  • Trading Signals
  • Uncategorized
  • World

Site Navigation

  • Home
  • Market News
  • Economic Calendar
  • About Us
  • Trading Signals
  • Free Demo Account
  • Home
  • Market News
  • Economic Calendar
  • About Us
  • Trading Signals
  • Free Demo Account

© 2019 High Leverage FX - All Rights Reserved.

No Result
View All Result
  • Home
  • Market News
    • Forex
    • Economy
    • Opinion
    • World
    • Markets
    • Politics
  • Economic Calendar
  • Trading Signals
  • About Us
  • Free Demo Account
[gtranslate]

© 2019 High Leverage FX - All Rights Reserved.