Tesla’s share price is trading at a ten-week low amidst an ongoing rout in global technology stocks, fears about Tesla’s underwhelming foray into China, and a series of erratic tweets from Elon Musk surrounding Bitcoin.
Markets are currently reacting to the news by some Chinese media outlets that Tesla sales in China plunged by sixty percent between the months of March and April, as other electric cars we favoured by domestic consumers.
Tesla shares have also been under pressure due to a semiconductor shortage and increasing competition from traditional automakers. Inflation caused by supply chain shortages and a chip shortage have put upward prices of new cars and raised fears about Tesla cars arriving at dealerships in time.
Elon’s Musk’s Twitter feed could also be a problem for Tesla bulls. Musk has been putting a series of cryptic Tweets, which appeared to put the electric car makers Bitcoin holdings into question.
Tesla made a significant amount of profit from Bitcoin during the first quarter. The ongoing slide in the price of Bitcoin could put downward price pressure on Tesla’s stock price due to their massive holdings of the top crypto.
Bitcoin has slumped below the $40,000 level this morning. This could hurt Tesla, as the company apparently bought massive amount of Bitcoin at an average price of close to $37,000.
Furthermore, legendary investor Michael Burry from the Big Short has place a huge bet against Tesla. Burry has placed a $530 million bet against Tesla, which could cause investors to take another look at Tesla’s fundamentals.
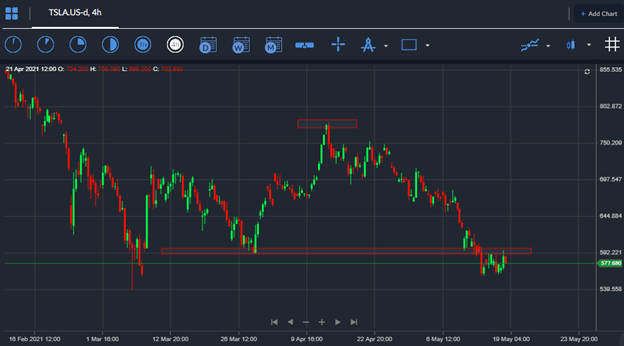
Tesla Short-term Technical Analysis
According to the four-hour time frame Tesla’s stock price has moved under the neckline of a large head and shoulders pattern, placing the electric car makers short-term prospects into question.
Neckline support, and the key breakdown area to watch is found at the $595.00 price region. According to the overall size of this historically bearish price pattern Tesla’s share price could fall towards the $410.00 to price area over the short-term.
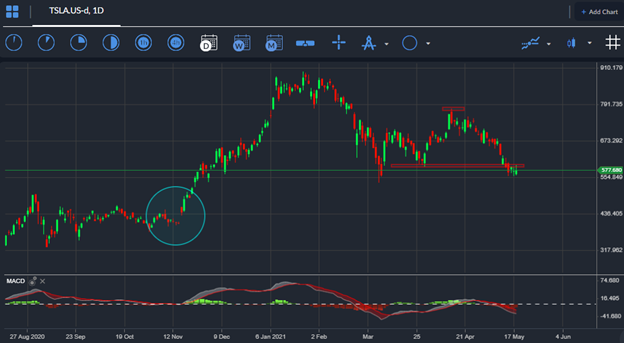
According to the daily time frame Tesla’s is trading towards the bottom of a large descending triangle pattern around the $530.00 support area. According to the overall size of the pattern a huge decline towards the $300.00 area.
Traders should also be aware that a price gap may need to be closed on the daily chart, around the $400.00 level. On an historical basis price gaps more often than not get closed on charts.


