The price of silver rallied sharply alongside gold and other precious metals last week, as the weak monthly jobs report from the United States economy was seen as being extremely bullish for the shiny metal.
Low rates, more QE from the FED and increasing inflation in the United States creates a goldilocks moment for silver and indeed gold. Weakening purchasing power of the US dollar, while commodity prices are rising is clearly bullish for silver.
Continued QE printing in the United States is likely to diminish the purchasing power of the US dollar currency. Markets had been cautious towards silver over recent months due to the expected US economic recovery. Friday’s jobs number put all this into question.
Silver also tends to rally when gold is moving higher, due to the strong price correlation the two metals share. It is often said that if you are bullish towards gold then you should be bullish towards the price of silver.
Something else to note is that supply in the physical silver market is extremely right now tight. So supply and demand issues could also propel the price of silver higher on the metals market this month.
On the technical front, silver has been promising to go parabolic once it crosses the $30.00 benchmark level for some time. Both lower and higher time frame analysis are projecting a parabolic price move once the long-awaited breakout above $30.00 takes place.
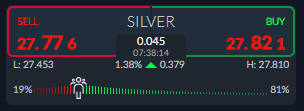
According to the ActivTrader Market Sentiment tool retail traders are on the right side of the trade right now, and becoming euphoric towards the recent move higher, with 81 percent expected further upside.
Watch out for a sharp correction to the downside while bullish sentiment remains at elevated levels. We could see a coming long squeeze if sentiment remains at these unsustainable and elevated levels.
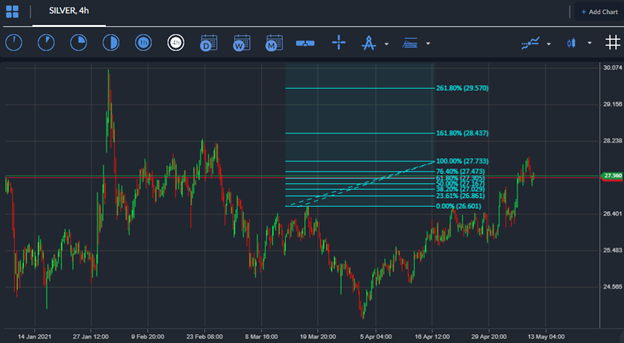
Silver short-term Technical Analysis
The short-term technicals for silver show that a complex inverted head and shoulders pattern will form if silver reaches the $30.00 level.
The size of the pattern implies that a $9.00 upside move higher could take place once silver crosses the $30.00 resistance level.
Bulls looking for a timely pullback may be able to enter into the prevailing bullish trend from the $27.30 to $27.10 levels. The $28.43 and $29.57 levels are the strongest forms of resistance prior to the $30.00 level according to Fibonacci analysis.
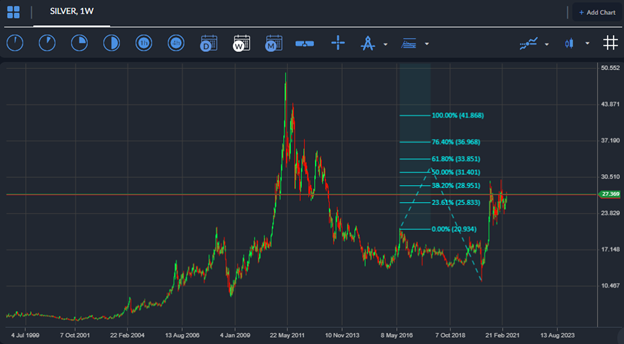
A large cup and handle pattern has been forming on the silver weekly chart for nearly a year and is warning that the metal could go parabolic once the price crosses above the $30.00 benchmark level.
According to the size of the pattern the $41.00 level is the initial target, however the $45.00 and $50.00 levels are even possible due to the parabolic nature of cup and handle patterns.


