fbpx
High Leverage FX
  • Home
  • Market News
    • All
    • Economy
    • Forex
    • Markets
    • Opinion
    • Politics
    • Tech
    • World
    Asian equities could take a boost after strong gains seen on US equities

    Asian equities may trade on the back foot as traders took profits during Wall Street session

    USDMYR Technical Analysis

    USDMYR Technical Analysis

    Asian equities observe positive start as optimism on Wall Street echoes

    Asian equities could trade with negative bias reflecting caution awaiting Nvidia’s earnings report

    Asian equities could take a boost after strong gains seen on US equities

    Asian equities likely to trade within narrow range following volatile session on Wall Street

    Asian markets may experience volatility as global participants eagerly await significant upcoming events

    Asian markets may experience volatility as global participants eagerly await significant upcoming events

  • Economic Calendar
  • About Us
  • Trading Signals
  • Free Demo Account
High Leverage FX
No Result
View All Result
Home Market News Tech

Nasdaq Technical Analysis – Opposing Patterns

Nathan Batchelor by Nathan Batchelor
August 25, 2022
in Tech
Reading Time: 3 mins read
0
Nasdaq Technical Analysis – Opposing Patterns
473
SHARES
16k
VIEWS
Share on FacebookShare on Twitter

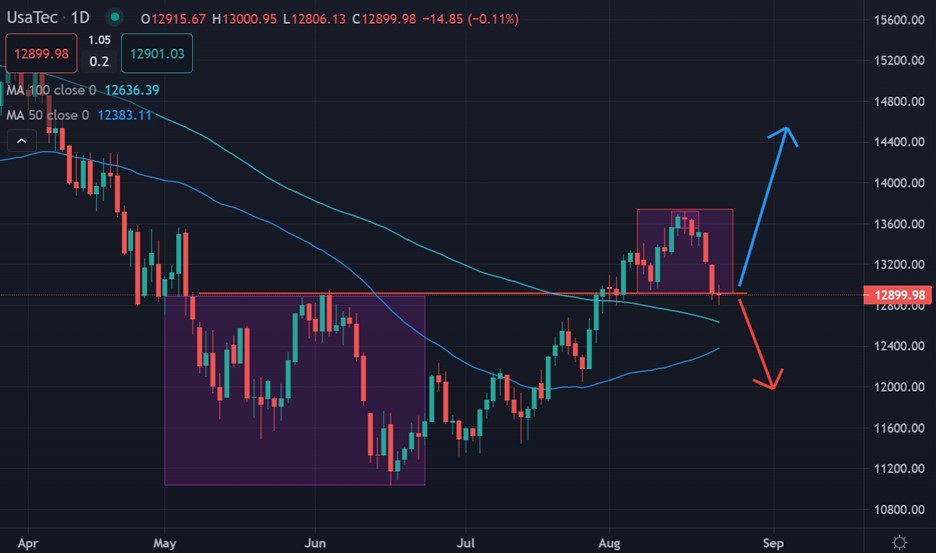
The Nasdaq has taken a sharp dive lower due to a major sell-off in risk-on trades, especially in tech-related stocks, following its most recent price rally towards the 13,800-resistance level.

Something is very apparent in the Nasdaq right now in that we are seeing two opposing price pattern doing battle against each other. The battle of the patterns will define the journey ahead for leading tech index.

Technical analysis is very clear right now in what it is saying if we look at these two price patterns. Either a new high towards 14,500 is coming, over a decline towards 12,000 is on the cards.

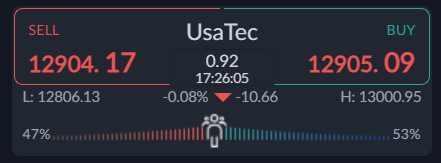
In order for us to determine the direction we probably need to pay close attention to the 12,900 level. This is the weekly pivot point, and actually the neckline of a large reversal pattern.

Weakness under 12,900 will be a bad sign this week, however, if bulls can defend this level, then the bulls stand a good chance at rallying the price back towards 13,400 region.

Traders sentiment towards the Nasdaq is only slightly bullish. This is encouraging for the current recovery, as the retail crowd is not yet overheated on the bullish side, and largely absent from the rally.

I think we could see the Nasdaq bearish bias starting to continue towards the leading US Tech index over the coming days and weeks as traders disbelieve the current rally. This would accelerate the upside.

Four-Hour Chart

See real-time quotes provided by our partner.

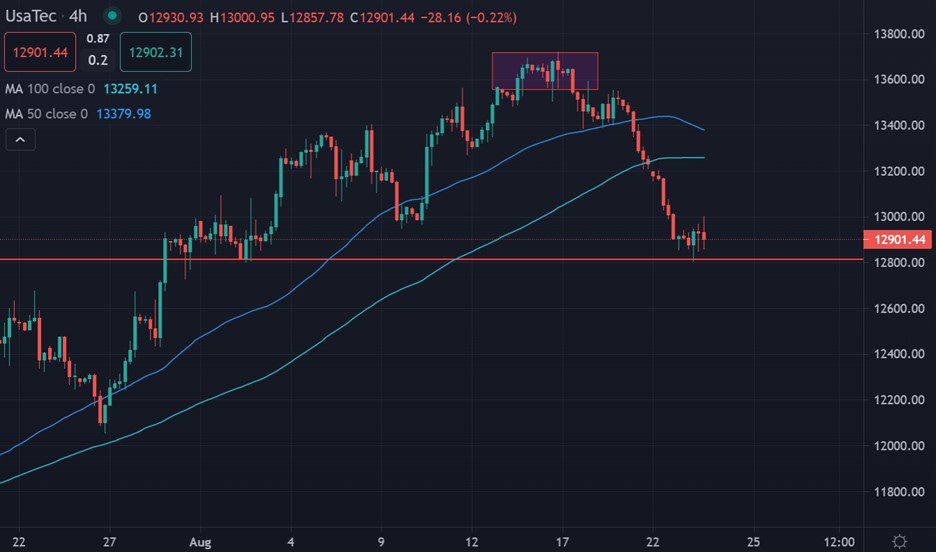
The Nasdaq index on the four-hour time frame has made a near technically perfect head and shoulders pattern. The price needs to correct higher one more time to make the pattern perfect.

If the index manages to hold above the 12800 level, then technical analysis is highlighting that the index could see a major recovery towards the 13,400-resistance area.

The Nasdaq index is currently bearish in the medium-term, however, the price is managing to hover above its 50-day and 100-day moving averages.

The possibility for movement to the upside is finally balance. Bulls may need to anchor the price above the 13,400 and then the 13,800 level in order for a mega rally to commence.

Daily Chart

See real-time quotes provided by our partner.

Tags: NasdaqTech
Previous Post

Morning Brief - Oil Price Rise Again

Next Post

Best Bitcoin mr bet test Casinos Inside 2022

Nathan Batchelor

Nathan Batchelor

Related Posts

Nasdaq Technical Analysis – Wedge Watch
Tech

US100 Technical Analysis – 1,400 Incoming

May 25, 2023
Market Insight – Apple Earnings
Tech

Market Insight – Apple Earnings

May 5, 2023
US100 Technical Analysis – Troubled below 13,800
Tech

Nasdaq Technical Analysis – 12,200 Incoming?

February 9, 2023
Tesla is a $1 trillion company again
Tech

Tesla Technical Analysis – Testing towards $180.00

January 25, 2023
Tesla Technical Analysis – Sinking towards $100.00
Tech

Tesla Technical Analysis – Sinking towards $100.00

January 4, 2023
US100 Technical Analysis – Troubled below 13,800
Tech

Nasdaq Technical Analysis – 9,000 Incoming?

November 7, 2022
Next Post

Best Bitcoin mr bet test Casinos Inside 2022

Leave a Reply Cancel reply

Your email address will not be published. Required fields are marked *


Market Overview

Categories

  • Economy
  • Forex
  • Gadget
  • Markets
  • Opinion
  • Politics
  • RSS Feed
  • Startup
  • Tech
  • Trading Signals
  • Uncategorized
  • World

Site Navigation

  • Home
  • Market News
  • Economic Calendar
  • About Us
  • Trading Signals
  • Free Demo Account
  • Home
  • Market News
  • Economic Calendar
  • About Us
  • Trading Signals
  • Free Demo Account

© 2019 High Leverage FX - All Rights Reserved.

No Result
View All Result
  • Home
  • Market News
    • Forex
    • Economy
    • Opinion
    • World
    • Markets
    • Politics
  • Economic Calendar
  • Trading Signals
  • About Us
  • Free Demo Account
[gtranslate]

© 2019 High Leverage FX - All Rights Reserved.