Gold prices are moving higher ahead after the midterm elections results and the U.S. inflation report that came in just a bit cooler than market expectations causing the Treasury yields and the US dollar to decline.
The U.S. consumer price index report for October came in up 7.7%, year-on-year, versus expectations for a rise of 7.9%, year-on-year, and compares to the 8.2% rise seen in the September report.
This report may be the most important data point of the month, if not the quarter. A slightly cooler reading in the CPI print may influence the Federal Reserve’s decision-making process ahead of its December FOMC meeting.
Gold could also be benefitting from this week’s fallout in crypto. Crypto currency markets remain in turmoil due to fears of a contagion effect and more illiquidity in the cryptos. The proposed takeover of likely insolvent FTX crypto exchange by rival Binance failed.
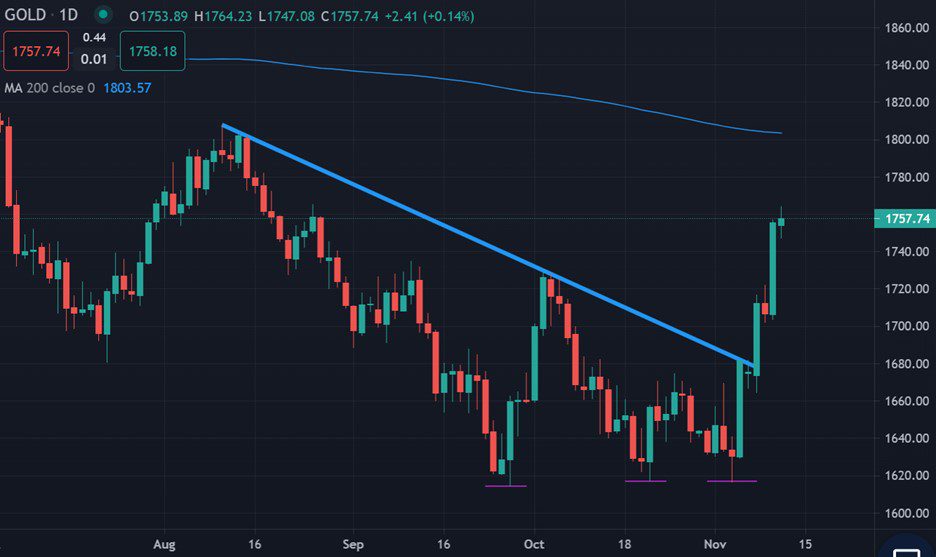
$1,800 remains the key level to watch ahead as this is the location of the yellow-metals trend defining 200-day moving average. Gold has basically been technically bearish all year.
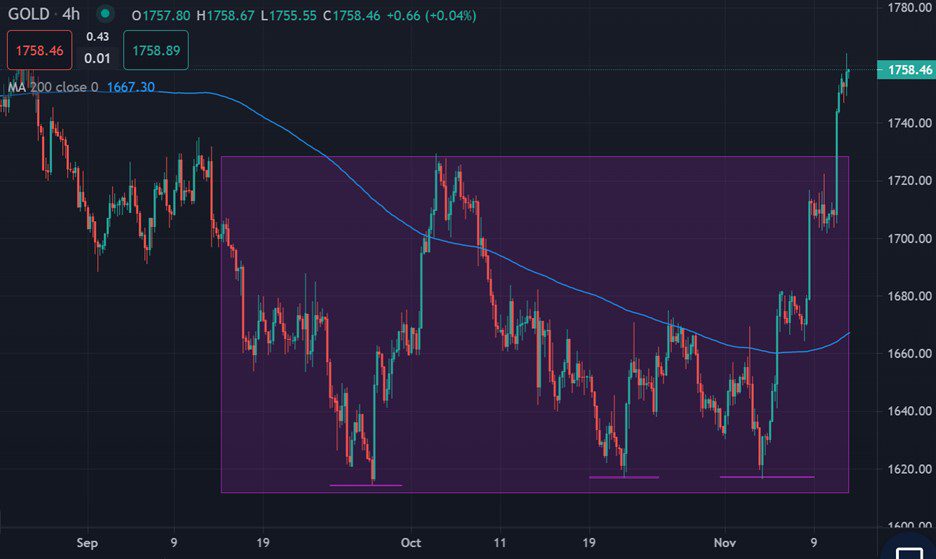
In terms of technical, keep a close eye on $1,720. This is a former breakout level for gold. If the price of gold hangs tough above this level then a trend reversal could be incoming.
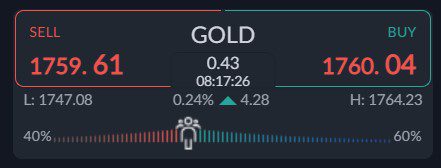
Current sentiment metric towards gold shows that sentiment still remains bullish, which could hint at a gradual move lower in the price of gold.
The ActivTrader market sentiment tool shows that 60 percent of traders are bullish towards gold. Going forward, we really need to see a negative bias by retail to help the chances of a sustained recovery.
Current sentiment metrics may make do not make it difficult for gold price to rally, especially with this key tech levels now broken.
Gold short-term Technical Analysis
According to technical analysis gold the price of gold has invalidated a huge head and shoulders patterns, which strongly hints at more upside ahead for the yellow metal.
According to technical analysis gold could receive more technical buy while above the $1,720 level. The target of the invalidate pattern is close to the $1,800 level.
The daily chart shows that the price of gold has also towards its key 200-day moving average, all eyes are now on a potential trend change.
Buying above the key trendline that is now broken around $1,680 is now in full swing. A triple bottom is also warning of more gains. This is a very bullish pattern.


