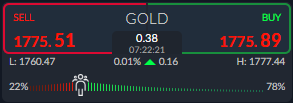
Gold has continued its shock decline on the metals market, with the yellow-metal slumping towards the $1,760 support area earlier today. Gold is now officially off to its weakest start to the year since 1991.
On a percentage basis gold is trading down by over seven percent since January, and very much looks to be on course for a third consecutive monthly loss. The recent rally in the US 10-year yield and the US dollar has effectively caused traders to sell non-yielding bullion.
The notion that the FED will raise rates quicker than expected continues to perpetuate through financial markets. A strengthening of the US economic outlook is therefore bad for gold, and something which upcoming US data points will continue to shine a spotlight on.
From a technical perspective the $1,760 level is a huge technical level the market will be paying close attention too. Gold edged towards this level earlier together, however, a quick technical bounce has taken place.
A sustained move under the $1,760 level would mean that a seven-month range break would take place. Weakness under the pivotal level could see the yellow-metal carving out a much-lower price range between the $1,585 to $1,760 levels.
Something else to watch out for is a rotation away from safe-haven metals, such as gold, and a move into more industrial metals, like copper. If the global economy is going to recover then industrial metals should benefit.
Bad weather in the United States is also helping to raise fears that energy and food inflation is going to be coming back at an alarming rate. If inflation starts to rise more than the Federal Reserve expect, financial markets will start pricing in higher US rates, which is bearish for gold.
According to the ActivTrader Market Sentiment tool traders are overly bullish towards gold with sentiment nearly 80 percent positive. This heavy one-way skew is concerning, and I would suggest further downside pressure is likely persist, and probably accelerate.
Gold short-term Technical Analysis
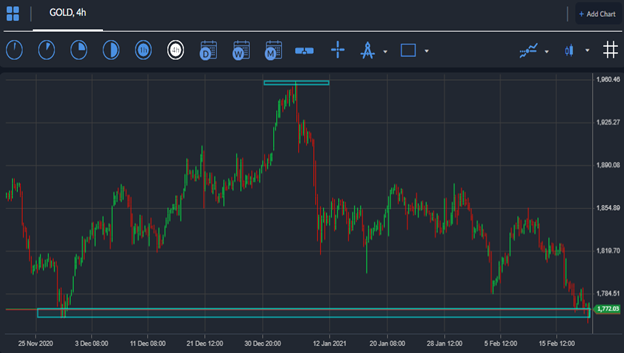
The short-term technicals for gold show that an extremely large head and shoulders pattern has formed, following the recent drop towards the $1,760 support level.
Weakness below the neckline of the mentioned pattern could take the price of gold towards the $1,560 level. The head of the pattern is found around the $1,950, which means that a $200 drop might be coming soon.
Gains above the $1,825 level is currently needed to stop the severe technical pressure engulfing the price of gold in the short-term.
Source by ActivTrader.
Gold Medium-term Technical Analysis
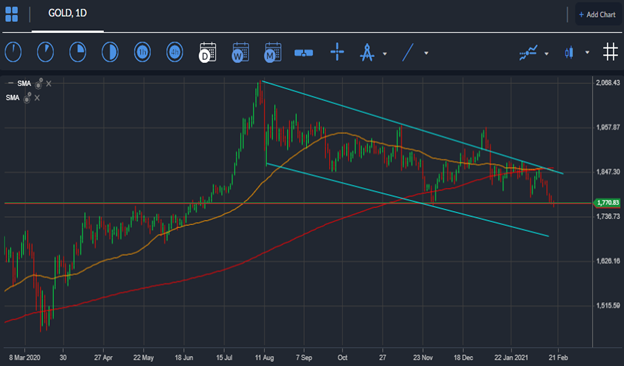
According to the daily time frame the $1,760 support level remains key. This is the November swing-low, and former bounce spot for $1,950. Weakness under this key area could send the price of gold into a much-lower trading range.
In terms of price patterns, gold is trapped inside a falling price channel, between the $1,850 and $1,660 levels. It is certainly possible that gold is headed towards the bottom of the price channel, around the $1,660 level.


