The price of gold failed to follow through to the upside last week, after the meeting selling pressure around the $1,800 level. However, the yellow metal is rebounding after finding more strong buying demand around the $1,755 level.
Data last week showed that gold consumption in China soared by 93.9 percent in the first three months from the same quarter a year ago. Data from the World Gold Council also showed that the recovery was driven by strong demand and rising investment.
Demand from China is not the only reason that gold has come back into favour. Future weakness in the US dollar currency, central bank money printing, and government spending are possible reasons why gold is rallying again. Additionally, seasonality metrics from the last 20 years are on gold’s side in May.
Data from BullishVault.com shows that May, June, and July are mildly positive months for gold on an historical basis. It should be noted that the best month for gold in terms of percentage returns are August and November.
Gold has also suffered this year as traders and investors diversify away from precious metals and into Bitcoin and altcoins. Digital assets have soared in value this year as they are fast becoming a form of protection against traditional currencies, that may be losing their purchasing power.
Looking at the week ahead for gold, watch out for a big directional move once we see the $1,756 to $1,800 price range broken. The technical shift is likely to be big once we finally do see a range break taking place.
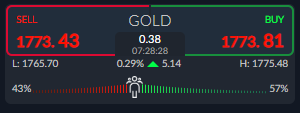
Current sentiment towards gold on the ActivTrader Market Sentiment tool shows that traders are growing slightly more bearish towards gold since last week, with 57 percent of traders positive towards the price of gold.
We probably need to see more negative sentiment here before we truly see the price of gold starts to rise, and finally breaking out. However, the move higher so far this week has certainly been encouraging.
Gold short-term Technical Analysis
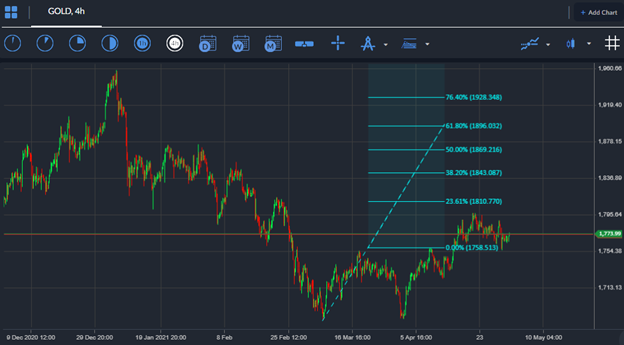
The short-term technicals for gold show that a large, inverted head and shoulders pattern in play, with bears recently testing back towards the neckline of the pattern after falling to move above the $1,800 level.
According to the overall size of the pattern the price of gold could rally towards the $1,870 region over the short-term. Gold faces stiff resistance around the $1,810 and $1,843 level if a breakout above the $1,800 level does occur.
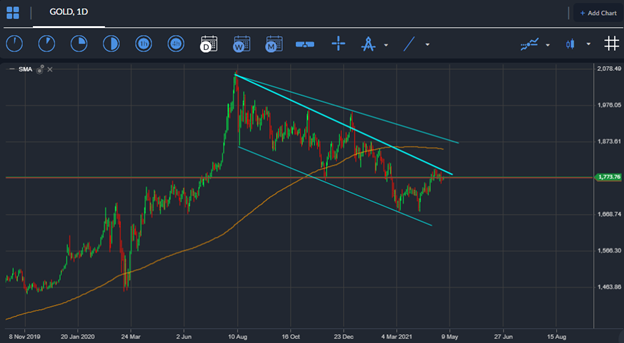
According to the daily time frame the price of gold is testing towards the top a falling price channel, which is currently located around the $1,780 resistance level.
If a sustained breakout happens then gold could surge as the price channel is pointing to a possible price advancement of nearly $200.00.
Another key falling trendline is in place around the $1,880 level, and is likely to be the medium-term bullish targets if a breakout above the channel takes place


