Gold could be set for a huge move on the precious metals market this week as the Federal Reserve meet to decide on interest rates, Dot Plots, and more importantly, QE purchases.
The yellow metal has typically performed best over QE being implemented. This is something to watch this week as it could be very hard for gold prices to rally amidst a swift reduction in QE.
Still, markets cannot know exactly how far the FED will go in tapering QE, but it is widely expected that the FED will double the pace of tapering from the previous month to counter inflation.
It should be noted that Gold Average Daily and Weekly True Range has moved to levels not seen since March 2020. This is the month when Gold went parabolic as COVID-19 measures were announced.
Falling volatility is often accompanied by rising volatility, and as the FED tapers I suspect we could see much of the gains in gold over the last few years practically reversed.
Gold has notable divergence across various technical indicators extending down towards the $1,300 level. In order for bears to take fully control we probably need to see weakness under the $1,680 area.
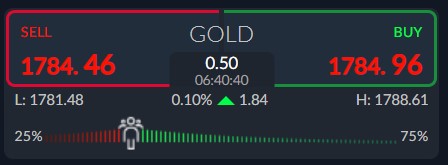
Current sentiment metric towards gold show that traders are becoming irrationally bullish. The ActivTrader market sentiment tool shows that 75 percent of traders are bullish towards gold.
This bullish sentiment towards gold suggest that a big move lower is very possible. Traders have remained bullish towards gold all-year, despite the yellow metal largely remaining in a down trend.
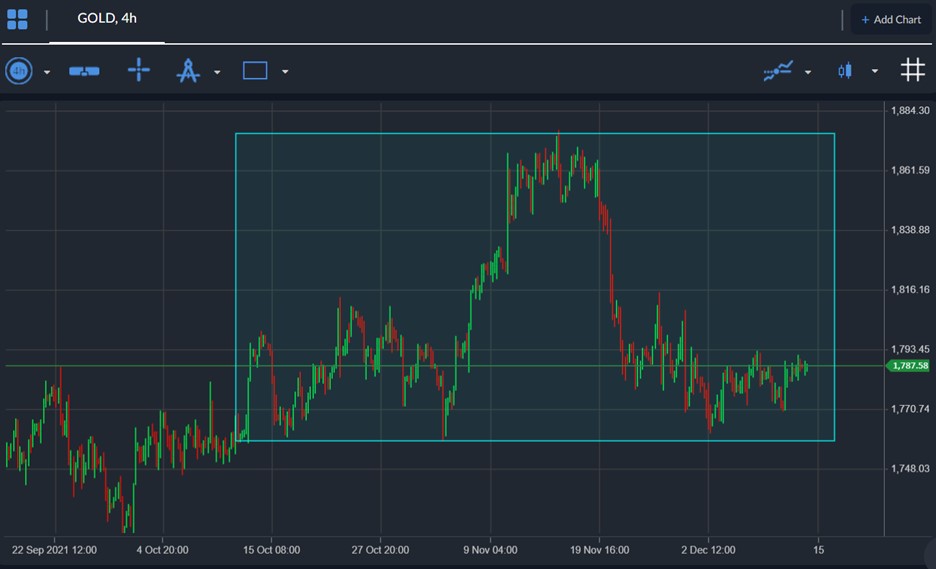
Gold short-term Technical Analysis
The short-term technicals for the yellow-metal show that a large head and shoulders pattern has been formed, following the recent price rejection from the $1,870 level.
Looking at the four-hour price chart, a break under the $1,730 support level is required to activate the bearish price pattern, which holds around 140 points of downside.
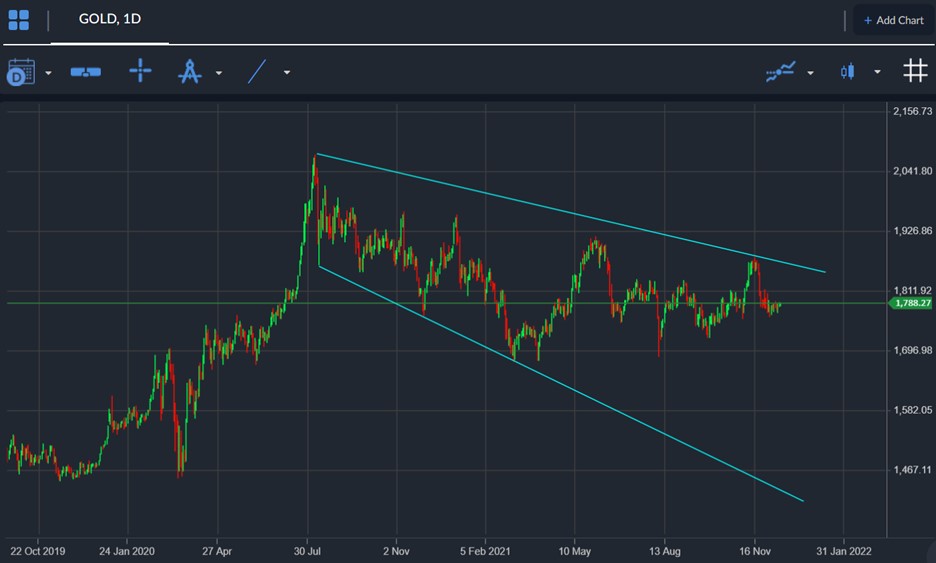
The daily weekly chart shows that gold only remains a buy over the medium while trading above the $1,730 level. Please be aware of my earlier comments on QE if we lose the $1,730 level.
If a bearish breakout takes place then the $1,680 level offer the last layer of support. Under $1,680 we should see the $1,550 and $1,480 levels quickly coming into focus.


