The price of gold has started the trade above its key 200-day moving average for the first-time since mid-June after the yellow metal caught a strong bid-tone after Federal Reserve Chair Jerome Powell’s latest speech.
Chair Powell said during his Congressional speech on Wednesday that inflation is likely to remain elevated, however, in the coming months it will fade. This caused traders and investors to think that the Fed could wait for a longer period before tapering QE or raising interest rates.
Other dynamics were also in play across broader financial markets that suggested the market embraced Powell’s comments in a dovish manner. A sharp fall in US Treasury bond yields took place shortly after Powell’s speech, which provided a strong lift to the non-yielding gold.
Strong selling around the US dollar also benefitted gold as the two are known to have an inverse relationship. Gold bulls now appear to be targeting the $1,850 as they gain traction above the yellow metals key 200-day MA.
Current sentiment metric towards gold is currently giving away clues as to whether the recent upside moment will stick. The ActivTrades market sentiment tool shows that 53 percent of traders are still bullish towards gold.
A drop in bullish sentiment has taken place over the last week which could suggest that less traders are expecting more gains in yellow metal. If the price is rising and sentiment is dropping then that is mildly bullish.
Gold short-term Technical Analysis
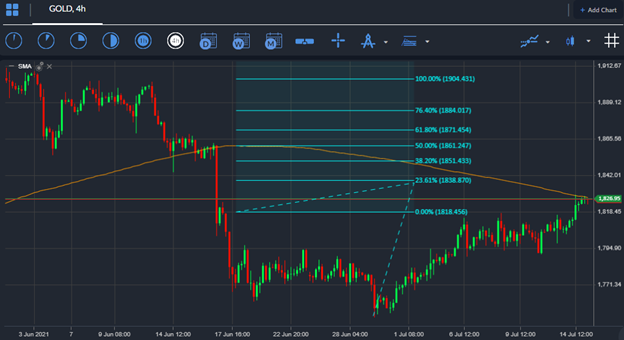
The short-term technicals for the yellow-metal shows that a bullish breakout from an inverted head and shoulders pattern is underway. The mentioned bullish pattern could easily overextend to the upside.
According to Fibonacci extension analysis the $1,860 level is the first bullish target if we use the former weekly high and the June low as the leading sequence. The 61.8 Fib extension of the mentioned sequence is found at the at $1,871 level and is a probable upside target.
According to the daily time frame, gold has bounced from a key technical support zone, meaning that gold is away from danger zone all the while it trades above the $1,800 level
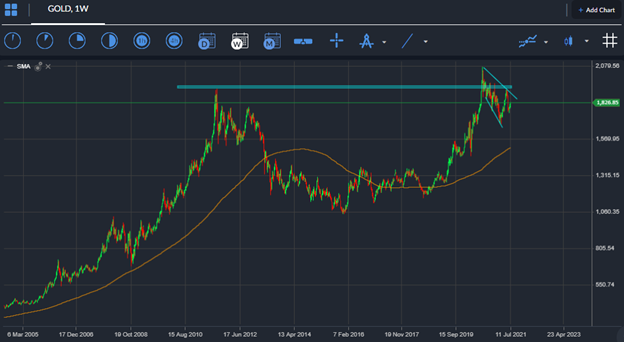
On a long-term basis, the weekly chart shows that gold is clearly starting to form a cup and handle pattern, which looks to be near completion. An explosive breakout above the $1,900 level could prompt a test of the $2,080 and $2,200 level.


