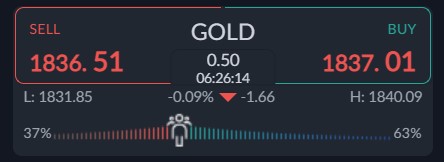
Gold has fallen to its lowest trading level since February this year, with the yellow metal reaching $1,833 earlier this morning as traders continue to de-leverage and move into the US dollar.
This latest move is contradicting market expectations as gold staged a monster rally towards the $2,000 level last month. The inflation narrative is not enough to support the price of gold during a time when all asset classes except the buck are under fire.
Gold continued to slump, even as investors turned to a risk-on mood Tuesday, as the yield on the benchmark US 10-year note eased back below the 3% psychological level and from the highest levels since 2018 at 3.20% scored on Monday.
According to analysts at TD Securities. ”Systematic trend followers are joining into the liquidation vacuum in gold. Finally, trend signals have sufficiently deteriorated to catalyse a substantial selling program in gold.”
The big support zone to watch is golds 200-day moving average, at $1,835, which was briefly breached earlier today. Even if gold recovers it must move above the psychologically important $1,850 level.
Current sentiment metric towards gold show that traders are bullish, and sentiment has increased about 3 percent since last week. The ActivTrader market sentiment tool shows that 63 percent of traders are bullish towards gold.
While this is not a huge sentiment bias it is bearish gold prices, as retail are not capitulating. We really need to see a negative bias by retail to help the chances of a strong rebound.
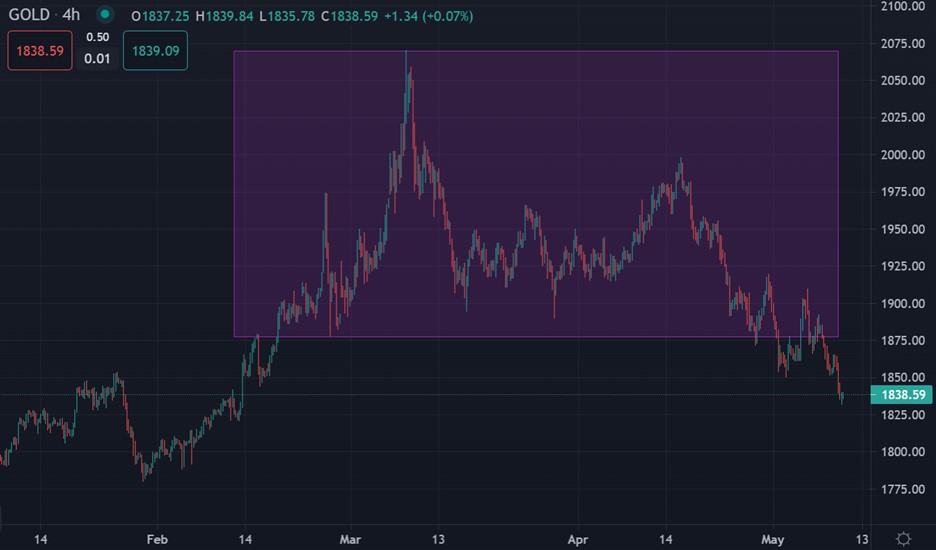
Gold short-term Technical Analysis
The short-term technicals for the yellow-metal shows that a technical breakout has taken place a large head and shoulders pattern, which is a historically bearish price pattern.
Looking at the well-denoted pattern on the four-hour price chart, a coming price drop towards the towards the $1,600 level seems likely. Keep your eye on the $1,875 resistance zone on bounces.
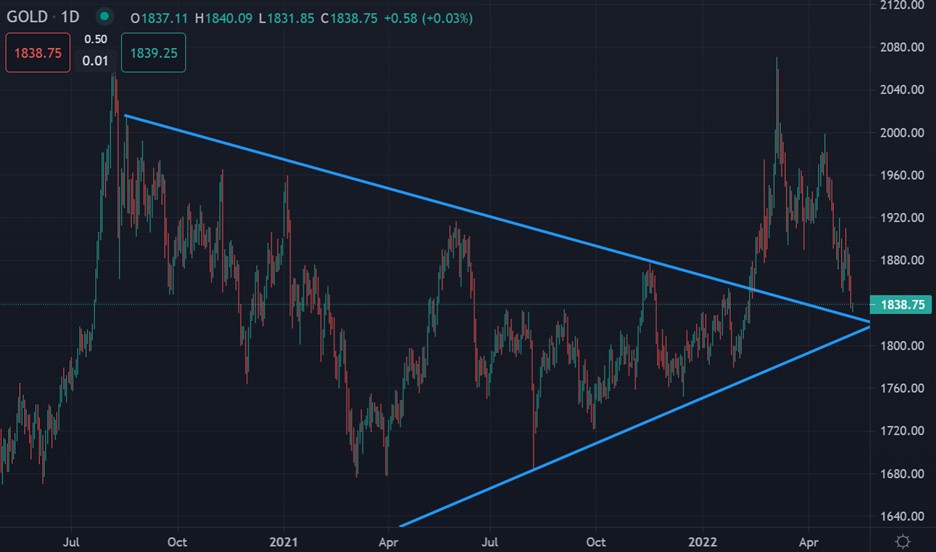
The daily chart shows that gold remains buy while trading above the $1,830 level, which is the location of a key former breakout from a huge triangle pattern.
I expect that the price corrections in gold is now done, and we could see further upside towards the $1,925 resistance level, and finally the $2,000. A break under $1,830 would be a large worry.


