The British pound has seen a major price reversal against the US dollar currency at the start of the trading week, with the pair finding support from the 1.3785 area and advancing back above the 1.3900 resistance zone.
Sterling had been unwinding from the 1.4000 area at a record pace after being trapped in a period of range trading between the 1.4090 to 1.4230 level for multiple weeks. Last week the GBPUSD has suffered its worst consecutive period of losses since September 2020.
Bulls may have an opportunity to buy the GBPUSD at more attractive and lower levels, however, the main question is whether Monday’s move is just a technical correction or a huge buying opportunity.
In order for the trend in the GBPUSD pair to actually turn technically and crack its 200-day moving average the price will need to move under the 1.3590 level. A major clue as to whether the trend is about to turn bearish is found around the April low, at 1.3650, which has so far been defended.
If bears can crack the 1.3650 price area this week then a larger price collapse is likely to take place as a large, inverted head and shoulders pattern will be invalidated. The size of the pattern implies that a price of drop of around 600 points could take place.
This week Bank of England policy decision will more than likely play a big hand in to whether the next phase of the technical meltdown is about to commence or whether the prevailing trend will remain intact.
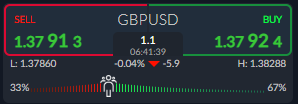
According to the ActivTrader Market Sentiment tool shows that some 32 percent of traders remain bearish towards the GBUSD pair right now. The large sentiment skew is warning of the potential for further losses. I think more downside in the GBPUSD pair is possible as too many traders are bullish.
GBPUSD Short-term Technical Analysis
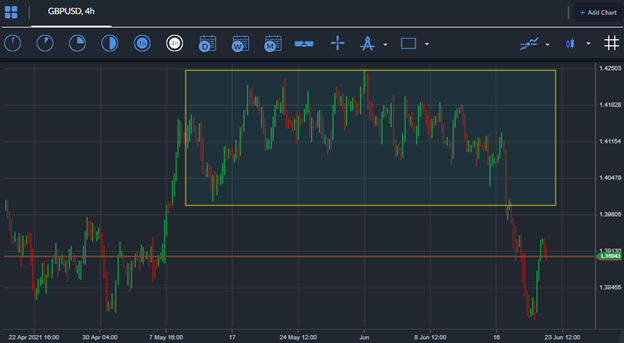
Looking at the four-hour time frame, the GBPUSD pair bounced from an important technical area on Monday. The area in question is a former breakout area from a falling price channel that the pair broken out from in April.
If bulls can maintain the price above the key former breakout zone the pair could recover back towards the 1.4090 price area. Remember, this is the bottom of the trading range from last week, and a key area that bulls must reclaim.
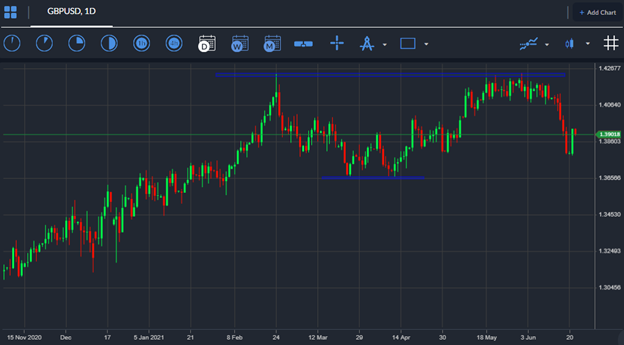
According to the daily time frame a huge, inverted head and shoulders pattern continues to loom of the pair, meaning the bigger picture still favours buying price dips.
This pattern holds an upside target of 600 points, which means the medium to long-term price path for the GBPUSD pair looks good while the price trades above the 1.3660 level.
Overall, the next 600-point directional move will probably take place once the 1.3660 to 1.4230 price range is broken.


