The FTSE100 is gaining traction alongside many other leading global indices at the moment in that the index is starting to test its all-time high after having a promising upside breakout last week towards the 7,900-resistance level.
A speech from Fed Chair Powell lifted the stock markets also as he failed to back track on his dovish rate stance, despite the fact the recent US jobs report came in with nearly 500,000 new payrolls created.
BP also posted better than expected results yesterday, gaining around 5 percent intraday, and making it the top riser on the FTSE100 index of blue-chip shares. This is also helping the push towards the all-time FTSE100 high.
Recently, petroleum companies have done very well as energy prices soar. This latest success has helped to drive up the FTSE100, which in turn will benefit people up and down the country with exposure to UK stocks in their pensions.
Going forward, an emergence of a range break in the FTSE100 above the 7,920 level could cause this index to surge, with a meaningful price breakout taking the index well above the 8,000 level for the first time ever.
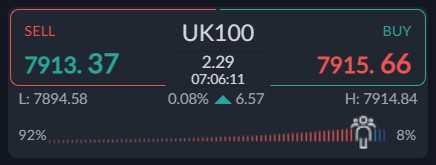
FTSE100 Sentiment Analysis
The Market Sentiment indicator on the ActivTrader platform currently shows that some 92 percent of traders are bearish towards the FTSE100 right now.
This could indicate that the FTSE100 will easily rally, as the retail crowd, now the majority, is typically wrong about the direction of the market.
In order for the index to move higher and break to a new and higher trading range, we probably need see bullish sentiment towards the UK100 staying this high. Overall, I suggest keeping a close eye on the current sentiment FTSE100.
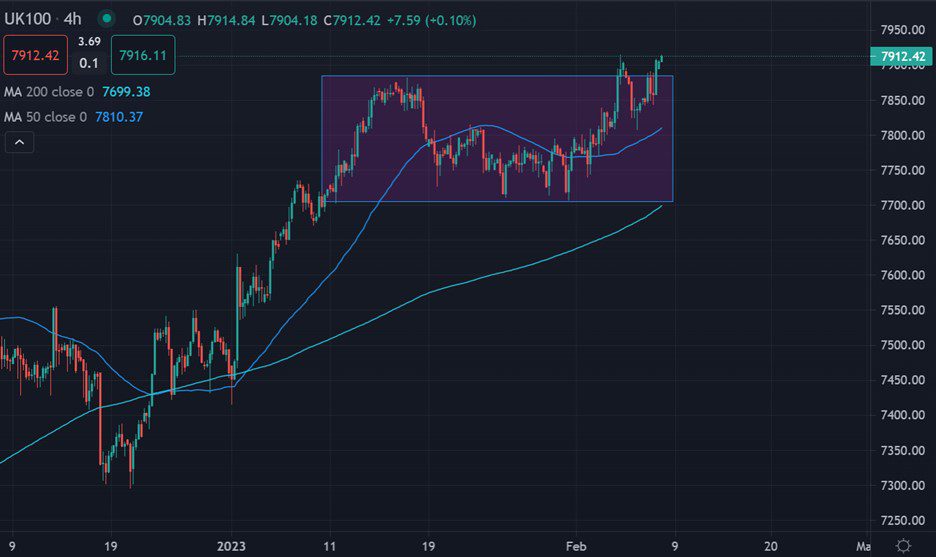
FTSE100 Technical Analysis
The four-hour time frame shows that the FTSE100 has formed significant bullish reversal pattern, which is alluding to more upside trading towards the 8,300 level. Also, a parabolic move above the 8,000 barrier is possible.
According to the overall size of the pattern the index is likely move towards the 8,300 level before its next correction. The 7,700 level offers strong support.
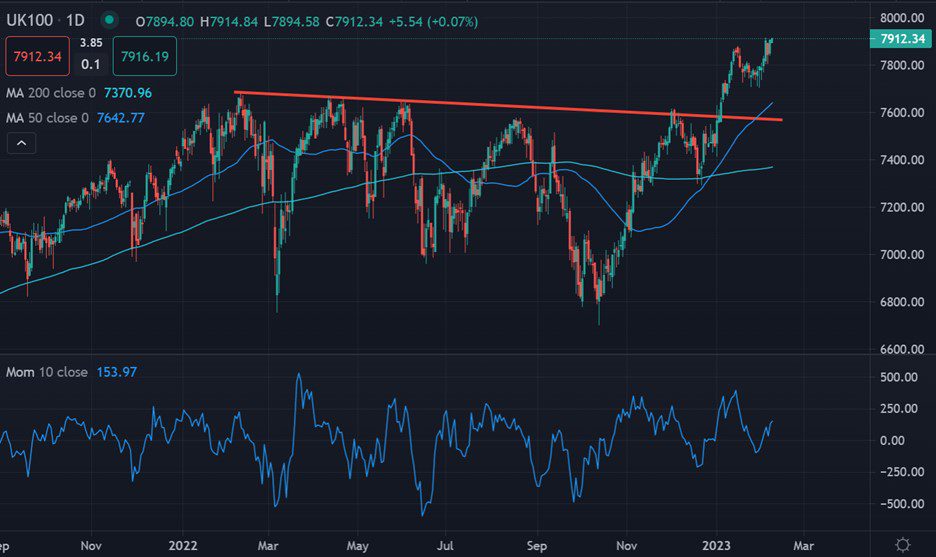
Higher time frame analysis is alligning with short-term analysis and is pointing to more upside, as as highligthed by the daily chart below an upside move of around 1,000 if now possible.


