The EURUSD had a very negative weekly and monthly price close last week after officially breaking below the 1.1700 level, which is something bears have been unable to do all year.
A major breakout in the US dollar index was the straw that broke the camels back for the EURUSD pair, as the 1.1700 level broke, the shared currency fell towards the 1.1550 area.
Potentially, cross buying from the EURGBP pair has helped starve off the worst for the EURUSD pair. This week will be particularly important as the pair is approaching some key technical levels.
The RSI indicator is showing that the EURUSD pair is now at its most oversold since January 2020 on a daily basis. Typically, the strongest bounces occur when currencies are very oversold.
Traders should keep a close eye on the 1.1500 to 1.1540 price area this week. If bulls can defend this area, then potentially a bounce back towards the 1.1700 level can take place.
A worst-case scenario for the EURUSD pair would be a breakdown under the 1.1500 level. This could spark a further sell-off towards the 1.1420 to 1.1380 support zone.
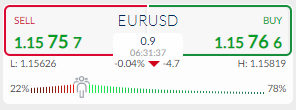
The ActivTrader Market Sentiment tool shows that some 78 percent of traders are bullish towards the EURUSD, meaning that most traders are still expecting an upside rebound in the pair.
Something that EURUSD bulls will need to see is widespread sentiment capitulation in order to be enticed towards buy the pair. Currently, this is not coming which is an ominous sign.
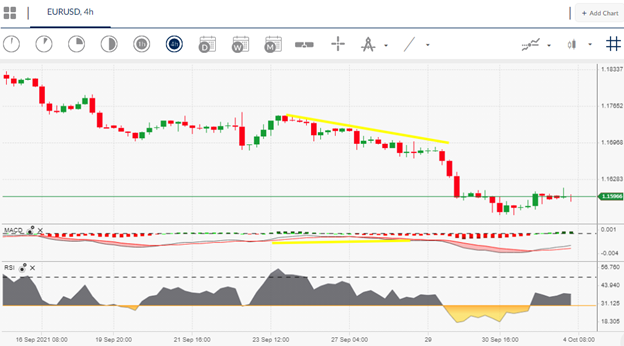
EURUSD Short-Term Technical Analysis
The four-hour time frame shows that a bearish price head and shoulders price pattern has broken to the downside and has played out to the downside to its full potential.
Now that a big sell-off has happened and the pattern has played out traders need to be on-guard for a rebound. The MACD and RSI on the mentioned time frame are also extremely oversold.
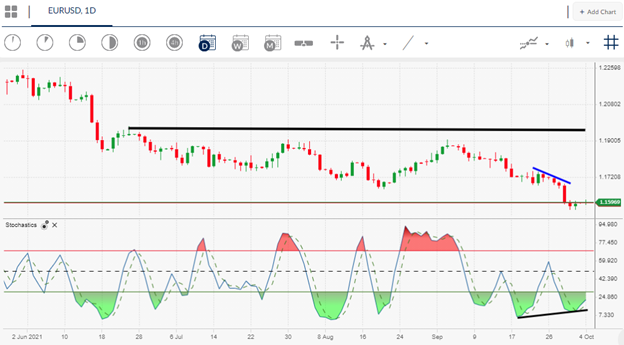
Looking at the daily time frame a large and complex inverted head and shoulders may be playing out, with last weeks big price drop provide the final head for the bullish pattern.
A series of daily price closes above the 1.1700 level should confirm that the pattern has officially formed, with a break above the 1.1900 level needed to activate the pattern.


