The Australian dollar has been hanging tough against the US dollar despite another round of weak Australian jobs figures and more soft economic data from China and the United States.
Yesterday, the Australian employment report for August showed that the extended COVID-19 lockdown had been hugely negative for jobs growth. The Australian Employment Change showed a negative 146,000 print, which is the bad news for the economy.
The only positive was the Unemployment Rate, which came in at 4.5%, at least giving some good news, and potentially stopping the AUDUSD pair dropping hard. However, the Australian Bureau of Statistics says it is seeing unemployed people dropping out of the labour force given the difficulties in going out to look for a job if you are in lockdown.
With global growth weakening and domestic Australia macroeconomic data worsening I think the AUDUSD pair is going to have a tough time holding above the 0.7300 level. Bearish CCI price divergence is also warning of a big unravelling.
The Commodity Channel Indicator shows huge amount of negative price divergence basically extending down towards the 0.7150 level, which is a major red flag of possible heavy losses to come.
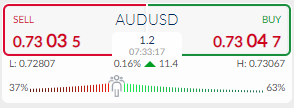
According to the ActivTrader market sentiment tool some 63 percent of traders are bullish towards the AUDUSD pair, which to me still suggest a very strong short-term trading bias has yet to form.
In order for the AUDUSD to really build sustained downside momentum we probably need to see strong bullish sentiment towards the pair emerging. As things stand, the modestly bullish bias does not suggest an imminent move.
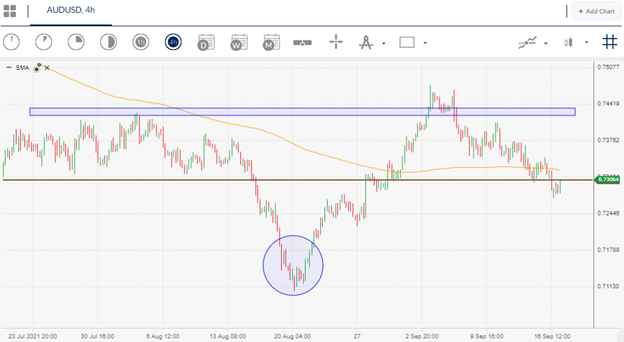
AUDUSD Short-Term Technical Analysis
The four-hour time frame shows that a large, inverted head and shoulders pattern has formed, following the recent rise back towards the 0.7435 resistance level and subsequent reversal from the 0.7100 area.
According to the overall size of the bullish price pattern a break above the 0.7425 resistance level is needed to activate the pattern. A final corrective move towards the 0.7150 level cannot be ruled out.
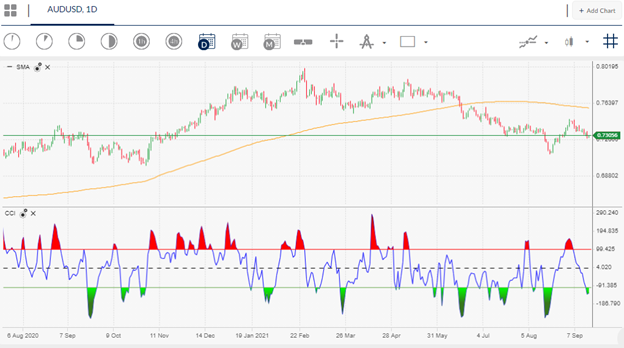
Looking at the daily time chart, the Commodity Channel Indicator has formed amount of negative price divergence basically extending down towards the 0.7150 level.
It should be noted that the bigger picture shows that a large head and shoulders pattern has played out fully to downside and is one of the reasons why the AUDUSD pair has recently bounced.


