fbpx
High Leverage FX
  • Home
  • Market News
    • All
    • Economy
    • Forex
    • Markets
    • Opinion
    • Politics
    • Tech
    • World
    Asian equities could take a boost after strong gains seen on US equities

    Asian equities may trade on the back foot as traders took profits during Wall Street session

    USDMYR Technical Analysis

    USDMYR Technical Analysis

    Asian equities observe positive start as optimism on Wall Street echoes

    Asian equities could trade with negative bias reflecting caution awaiting Nvidia’s earnings report

    Asian equities could take a boost after strong gains seen on US equities

    Asian equities likely to trade within narrow range following volatile session on Wall Street

    Asian markets may experience volatility as global participants eagerly await significant upcoming events

    Asian markets may experience volatility as global participants eagerly await significant upcoming events

  • Economic Calendar
  • About Us
  • Trading Signals
  • Free Demo Account
High Leverage FX
No Result
View All Result
Home Market News Tech

Nasdaq Technical Analysis – Wedge Watch

Nathan Batchelor
July 14, 2022
in Tech
Reading Time: 2 mins read
0
Nasdaq Technical Analysis – Wedge Watch
448
SHARES
14.4k
VIEWS
Share on FacebookShare on Twitter

The NASDAQ corrected lower after the recent record high CPI report; however, all may not be as it seems as it could be the case that the US tech index is just performing a standard correction.

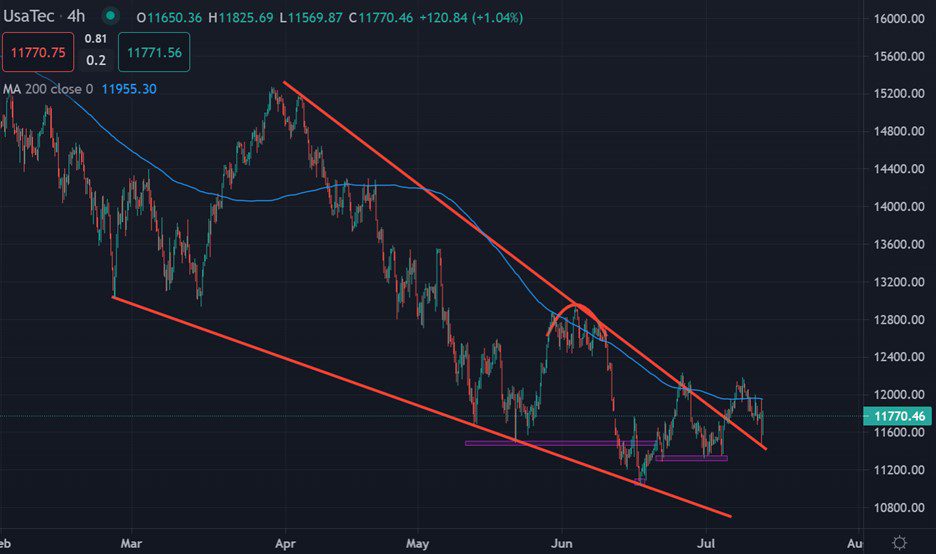
Technically, the set-up looks perfect. The NASDAQ recently broke out from a well-defined wedge pattern and surged towards the 12,200 level and has subsequently returned to the scene of the initial breakout.

Yesterday, the US CPI came in much stronger than expected with a 1.3 percent monthly rises. The Consumer Price Index in the United States also rose 9.1 percent from a year ago, a 40-year high that defied expectations of moderating price pressures.

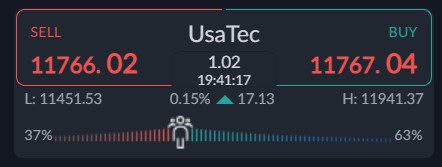
Based on the market reaction, we could see a bottom forming in the NASDAQ, however, it is essential that the 11,700-support level holds over the coming days and weeks.

Traders sentiment towards the Nasdaq is still bullish. This is not very encouraging for the current recovery, as the retail crowd is typically on the wrong side of the trade when new trends emerge. However, the bias is not too wide.

I think we could see the Nasdaq bullish bias starting wane towards the leading US Tech index over the coming days and weeks.

Four-Hour Chart

The Nasdaq index on the four-hour time frame and looks like it is making a perfect technical test back towards a former breakout from a massive falling wedge pattern.

If the index manages to hold above the 11700 level, then technical analysis is highlighting that the index could see a major recovery towards the 12,000-resistance area.

See real-time quotes provided by our partner.

Daily Chart

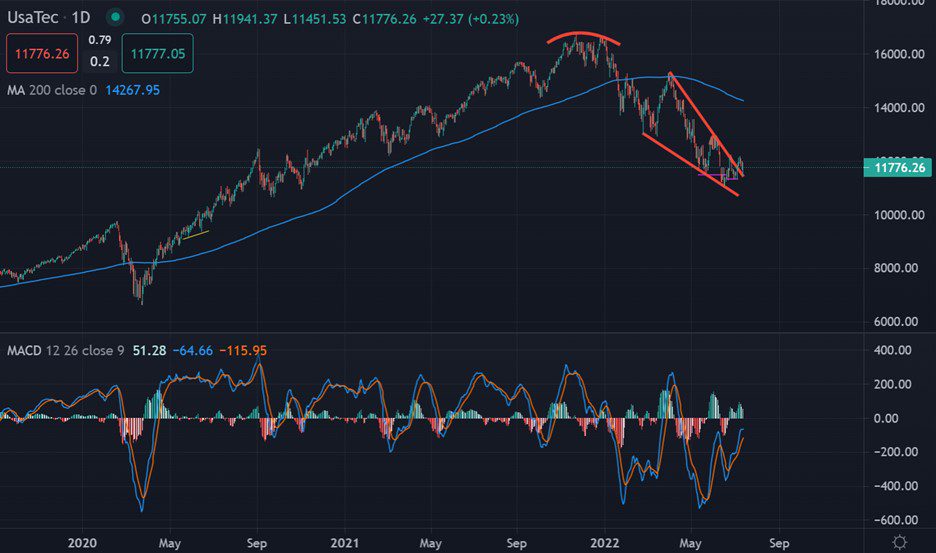
The Nasdaq index is currently bearish in the medium-term despite the recent price correction. A move above the 14,100 level is needed to change the price trend.

The possibility for movement to the upside is however high probability. Bulls may need to break above 13,000 near-term resistance for any further gains to the upside.

See real-time quotes provided by our partner.

Tags: NasdaqUS CPI
Previous Post

NZDUSD Technical Analysis - Sentiment Still A Concern

Next Post

‎‎ slots no deposit required position Bonanza

Nathan Batchelor

Nathan Batchelor

Related Posts

Nasdaq Technical Analysis – Wedge Watch
Tech

US100 Technical Analysis – 1,400 Incoming

May 25, 2023
Market Insight – Apple Earnings
Tech

Market Insight – Apple Earnings

May 5, 2023
US100 Technical Analysis – Troubled below 13,800
Tech

Nasdaq Technical Analysis – 12,200 Incoming?

February 9, 2023
Tesla is a $1 trillion company again
Tech

Tesla Technical Analysis – Testing towards $180.00

January 25, 2023
Tesla Technical Analysis – Sinking towards $100.00
Tech

Tesla Technical Analysis – Sinking towards $100.00

January 4, 2023
US100 Technical Analysis – Troubled below 13,800
Tech

Nasdaq Technical Analysis – 9,000 Incoming?

November 7, 2022
Next Post

‎‎ slots no deposit required position Bonanza

Leave a Reply Cancel reply

Your email address will not be published. Required fields are marked *


Market Overview

Categories

  • Economy
  • Forex
  • Gadget
  • Markets
  • Opinion
  • Politics
  • RSS Feed
  • Startup
  • Tech
  • Trading Signals
  • Uncategorized
  • World

Site Navigation

  • Home
  • Market News
  • Economic Calendar
  • About Us
  • Trading Signals
  • Free Demo Account
  • Home
  • Market News
  • Economic Calendar
  • About Us
  • Trading Signals
  • Free Demo Account

© 2019 High Leverage FX - All Rights Reserved.

No Result
View All Result
  • Home
  • Market News
    • Forex
    • Economy
    • Opinion
    • World
    • Markets
    • Politics
  • Economic Calendar
  • Trading Signals
  • About Us
  • Free Demo Account
[gtranslate]

© 2019 High Leverage FX - All Rights Reserved.