I previously wrote about Alphabet’s proposed stock split of 20-to-1 back in February 2022, before the world’s attention was drawn to the Eastern borders of Ukraine. During a time when high growth companies are under pressure from inflation worries and safe-haven flows, Amazon announced a 20-for-1 stock split and a share buyback of up to $10bn last week, which sent Amazon stock surging ~7 %. The buyback would lower shares outstanding and hopefully create higher earnings per share (EPS). The smaller nominal share price would still allow smaller speculators to place their money with the company or allow Amazon employees to liquidate a fraction of their shares in smaller blocks.
As per the Alphabet stock split, the mechanics of the stock split technically does not change the company’s fundamental value (market cap) but can lead to more retail interest and greater liquidity. Thus, encouraging demand and higher share prices in the future. This is not Amazon’s first stock split rodeo; this is the fourth stock split in the company’s 28-year history. The last came in September 1999. Today’s share price is around 4000% higher than at the turn of the millennium.
If shareholders approve the new split-adjusted basis at Amazon’s May annual general meeting, trading on the new shares will begin on June 6th, 2022. The total number of outstanding shares will grow by 19 for everyone owned by investors, reducing the value of each share while increasing the number outstanding.
Amazon is following in the footsteps of Apple, Tesla, and Alphabet in splitting its shares. The share price of these companies has risen significantly during the pandemic, and it appears that Apple and Tesla are doing well since their stock split. Whether Google is trying to get listed on the Dow Jones and whether Amazon aspires to that too, is still an unknown. An emailed statement said the split aims at giving employees “more flexibility in how they manage their equity” and making the stock “more accessible” for average investors.
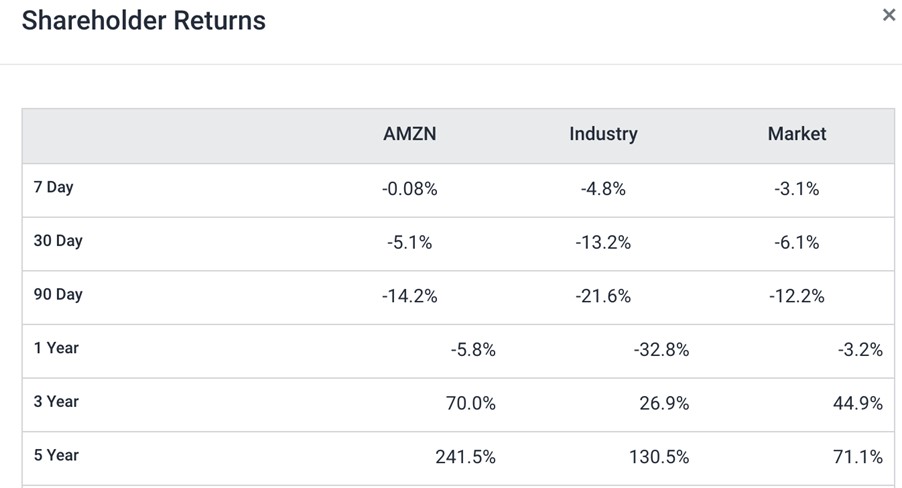
During this period of geopolitical uncertainty, Amazon’s share price is significantly off its recent highs. Following the post-pandemic warning, the company’s stock price began to decline due to supply-side hurdles, labour shortages, and increased shipping costs.
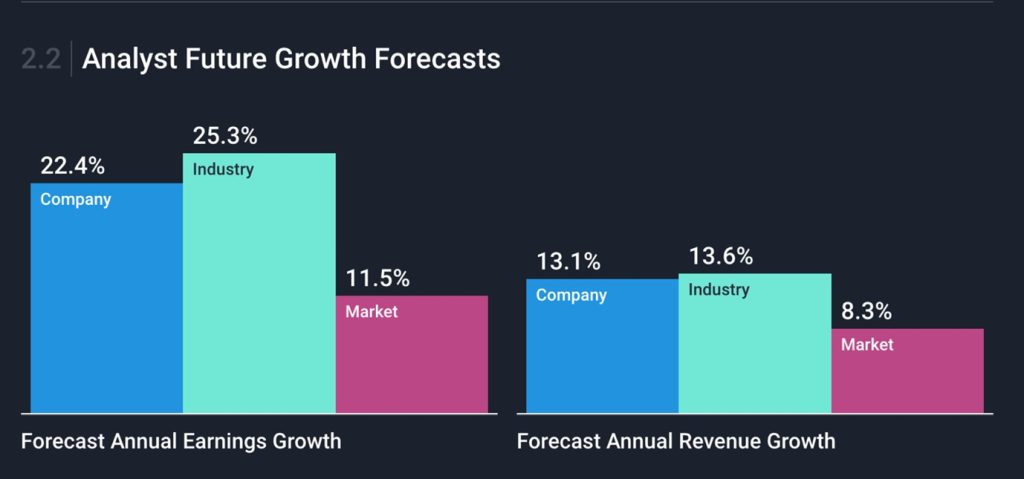
Massive growth has been seen in sales of the company’s cloud unit, which sells server capacity and software tools and accounts for a significant portion of the company’s operating profit. During the previous quarter, Amazon’s diversification of sales helped compensate for the decline in online store sales as its cloud-computing and advertising businesses ramped up. This led to a blockbuster earnings report for the company. With Amazons future growth forecasts so high, they are a better bet than the whole market currently. So for those looking to divest from the Nasdaq index, they may still consider holding individual shares in Amazon.
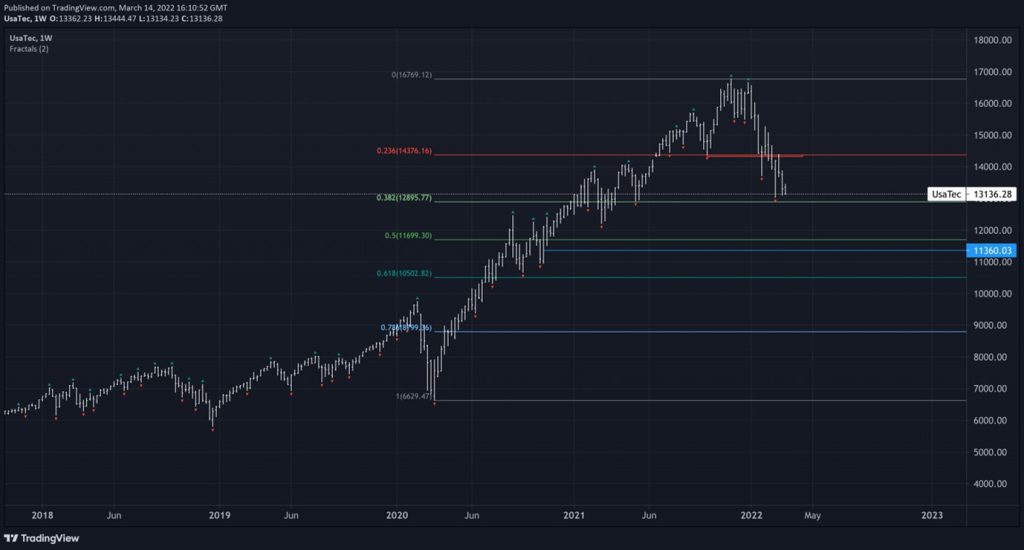
As part of my daily analysis of the Nasdaq, I consider Amazon as one of the leading stock indicators. When Amazon, Google, Facebook, Tesla, Apple & Microsoft share prices increase together, the index usually follows. And vice versa. As per the chart before the rise in Amazon has not been enough to drag the other 99 companies higher, so we should also expect some short-term weakness to enter back into the Amazon share price.
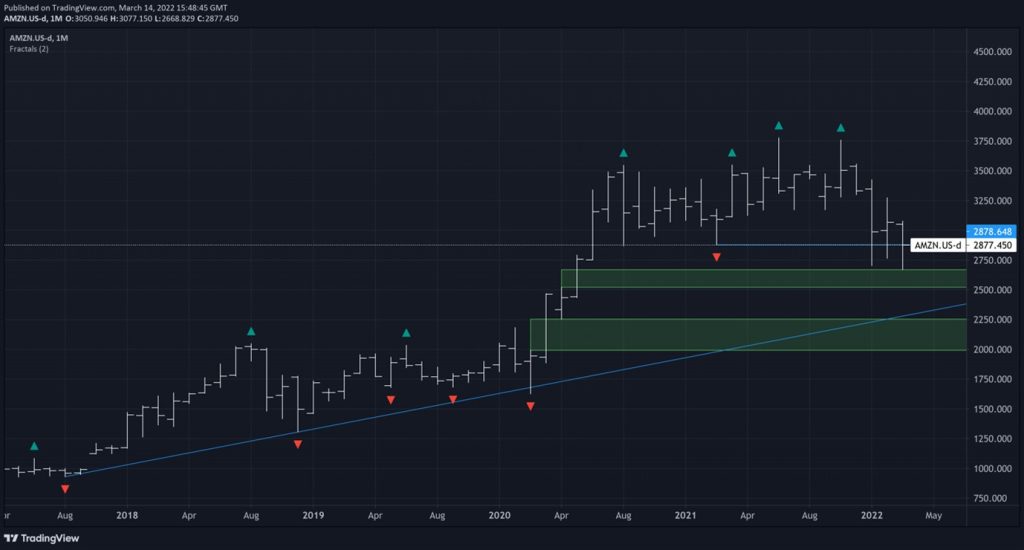
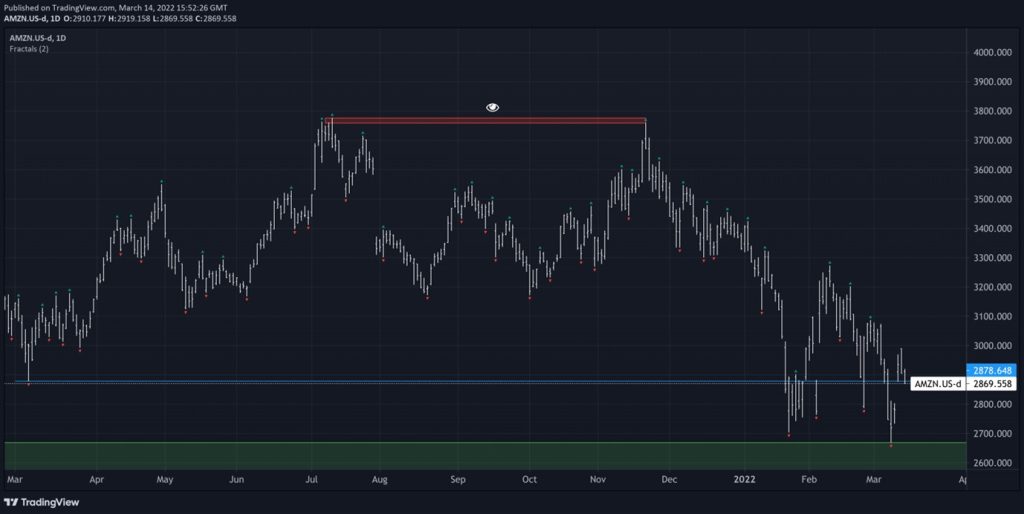
On the daily Amazon chart, we can see the gap created after the stock split announcement still needs to be filled, as historically the gaps are generally filled. There has also been a change in market structure when the daily close finished below the swing low from 8th March 2021. Momentum following algos won’t necessarily get fully involved in the stock until they see a new higher high and a higher low. Which would require a close above 3300 and the most relevant significant high.
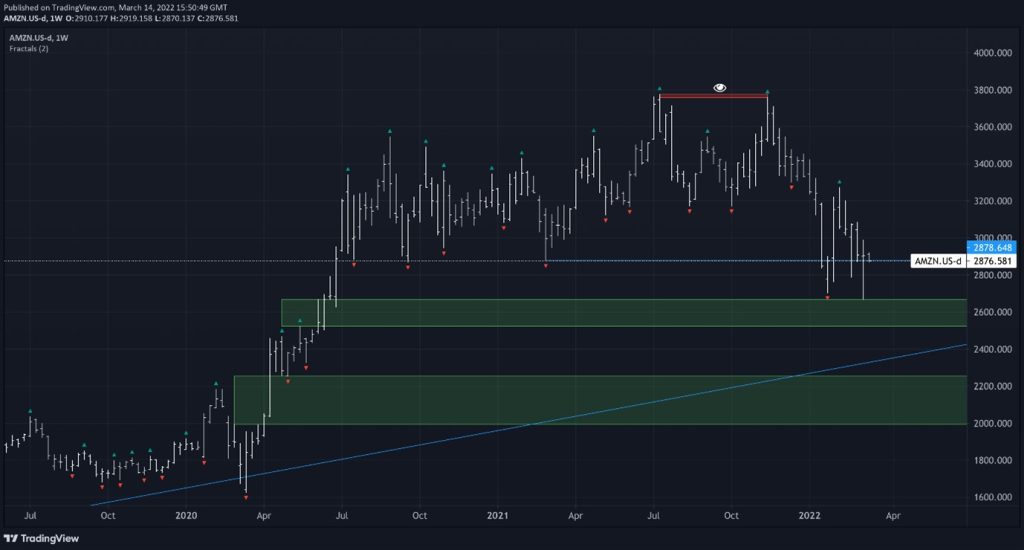
The weekly chart is the clearest for technical analysis purposes. The green boxes highlighted below current price are where there is an imbalance created by the impulsive moves and exuberant buying, when everything was going higher on stimulus and QE. The areas of imbalances make a good target when things retrace. The yearlong range from July 2020 to July 2021 is also a key area to consider. Along with the double top formed in late 2021 and highlighted on the weekly chart in red. If price were to get back above the recent swing high, that places the PA above the middle of the range and opens a path of least resistance to the double top high and liquidity pool residing there. As we can see from recent weekly price action, getting through that zone of balance is very difficult currently and the path of least resistance is to the downside. Studies have shown though how well stocks do post their stock split, so true investors would welcome lower prices ahead of that time to buy into Amazon at a discount.


