The US dollar started to pullback against the US dollar at the start of the trading week, however, the losses in the USDJPY pair have not been as dramatic as other USD-based pairs.
The focus at the end of last week was that US retail sales were not ‘material’ enough to spark a 100-basis point rate hike by the Fed next week and that saw the dollar falter as market bets retreated.
Additionally, the mood toward the US economy started to worsen after bad Housing data from the US economy. The FED made be reluctant to hike too fast if the housing market slows.
The mood is therefore continuing at the start of the week, with risk tones also leaning towards more positivity to fewer rate hikes as we are seeing the greenback slipping.
The problem that USDJPY bears face now is very bullish technicals. A series of bullish price patterns are predicting further strong gains ahead towards at least the 140.00 level.
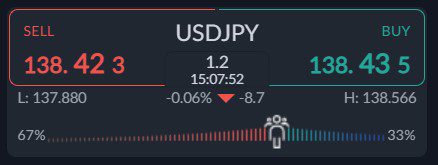
Something that could be a positive right now is bearish sentiment towards the USDJPY. Sentiment has fallen slightly, but it is bearish enough to cause more strong price gains ahead for the USDJPY pair.
The ActivTrader Market Sentiment tool shows that some 67 percent of traders are bearish towards the USDJPY. I believe we could see the up-move slowing, but sentiment is still suggesting more gains ahead.
USDJPY Short-Term Technical Analysis
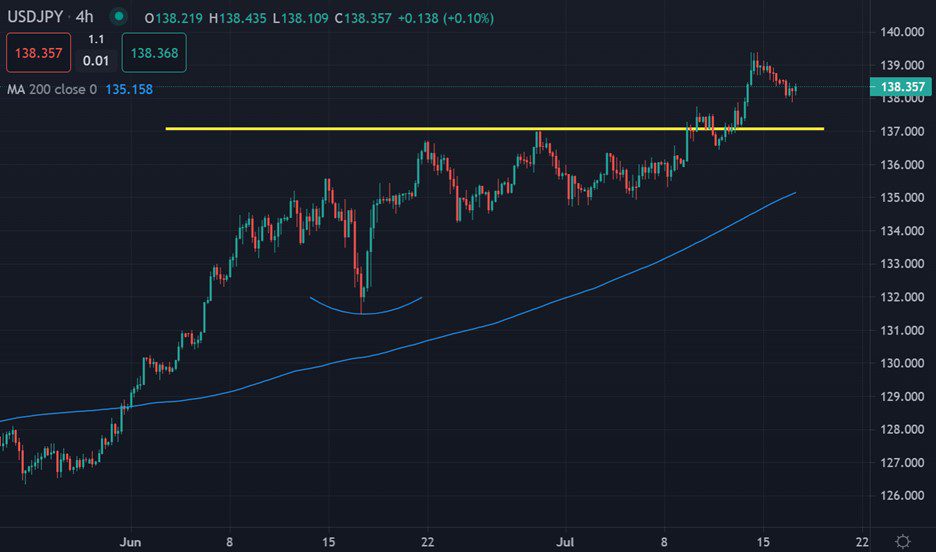
The four-hour time frame shows that the USDJPY pair has activated a bullish inverted head and shoulders pattern, which has yet to fully play out to the upside just yet.
According to the potential upside target, as measured by the size of the inverted head and shoulders pattern, we could reasonably expect to see the USDJPY pair testing towards the 141.00 level.
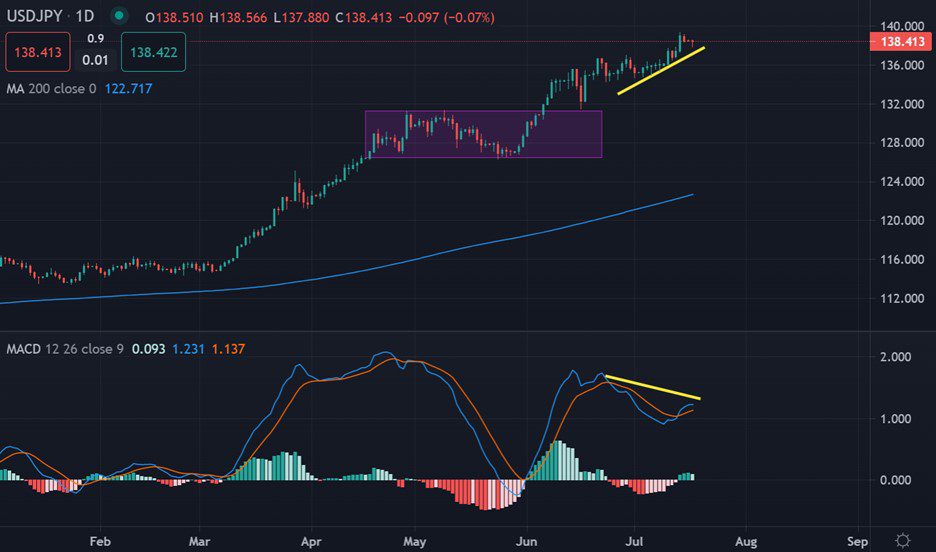
Looking at the daily time frame things are seeing bullish still as a large, inverted head and shoulders pattern has been activated now and is close to reaching its target.
Watch out for a further rally above 140.00, and possible the 141.00. There is negative divergence on the MACD indicator down towards the 135.00 support region.


