The US dollar has been surging higher against the Japanese yen currency due to a big improvement in risk-on sentiment due to fears over a China Evergrande default subsiding and positive US earning season results.
A recent failure around the 114.50 region has caused the upmove to pause, with traders questioning whether the USDJPY pair is bullish or bearish in the short-term, and it could lower still.
Looking on the charts the USDJPY pair is a country mile away from its key moving averages. The USDJPY pair’s 200-day moving average is around the 110.00 region, while the four-hour 200-period MA is way lower, at 111.80.
Another big problem for traders is to do with US dollar weakness. Can the USDJPY pair head higher while the US dollar index breaks down. It is going to be incredibly hard to do this without a powerful stock rally.
As things stand, weakness under the 113.90 level is likely to trigger more losses towards the 113.60 area. Additionally, a break above the 114.50 area exposes further gains towards the 115.00 price zone.
Over the coming days I would suggest keeping a close eye on the 113.50 to 113.90 support region. This is the big bounce or capitulation. I would also suggest keeping a close eye on the Nikkei225.
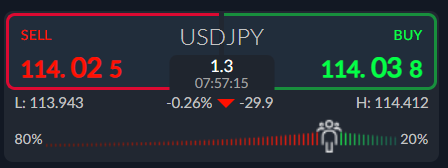
According to the ActivTrader Market Sentiment tool some 80% of traders are bearish towards the USDJPY pair, which may hint those further gains are coming as bearish sentiment is very strong.
This could become a big bullish constrain signal which is pointing to more USDJPY gains, and we should also consider that while bond yields are breaking out this is further supportive for USDJPY gains.
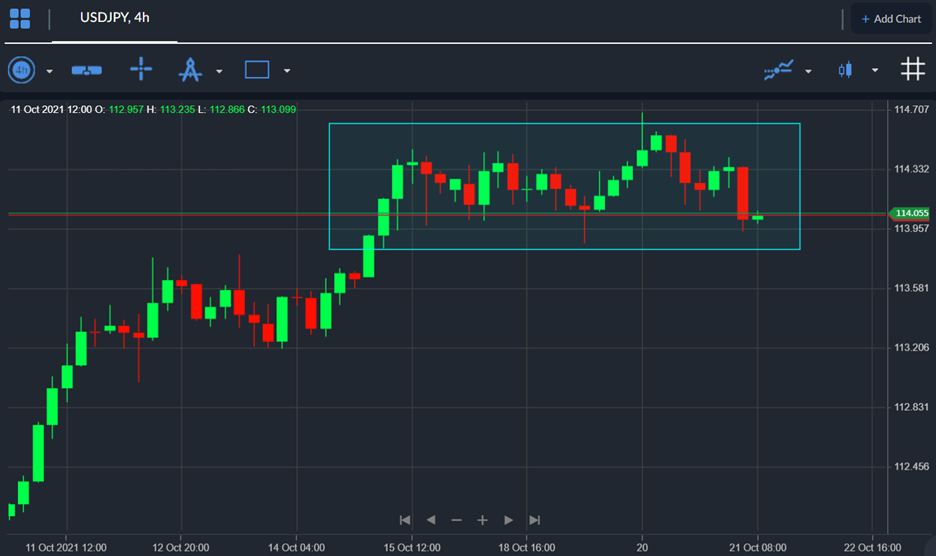
USDJPY Short-Term Technical Analysis
Technical analysis on the four-hour time frame shows that the USDJPY pair has either formed a large head and shoulders pattern or a large, inverted head and shoulders pattern.
According to the overall size of each potential pattern the USDJPY pair could be preparing to stage a move of around some 80 points.
The daily time frame is showing that the USDJPY is trading well above the 112.40 area, which was a key breakout area from earlier this month.
We do have a lot of negative price divergence forming since 110.00, however, the USDJPY pair could surprise if stock push higher, and actually tests towards multi-year trendline resistance, around the 116.00 area.


