The USDCAD long trade has been one of the worst pain trades for bulls over recent months, as the US dollar fails to make upside traction against the Canadian dollar, despite the greenback gaining traction against most major currencies.
One of the major reasons for the Canadian dollar remaining so strong against the US dollar has been the surge in oil prices this year. The almost one-way advance since November has only intensified over recent days and weeks.
Traders have been trapped on the wrong side of the trade, as retail sentiment towards the USDCAD pair has been extremely bullish, and one-sided over recent months. The USDCAD pain trade could get worse for bulls if the Bank of Canada come out with a hawkish tone later today.
The central bank is widely tipped to maintain current monetary policy and keep interest rates at a record low 0.25 percent. However, the Bank of Canadian policy members are likely to acknowledge that the rise in oil prices has boosted the prospects of the Canadian economy, and the economy becoming stronger than anticipated.
Markets may start to think that the central bank could taper QE sooner than expected. If the market believes that QE will be withdrawn quicker by the Bank of Canada than the Federal Reserve, then this could cause further USDCAD weakness.
Another big market mover for the USDCAD pair this week will be the CPI inflation report. If US CPI runs hot, as widely expected, then hawkish tones from the BOC could be overridden by signs of inflation in the CPI report.
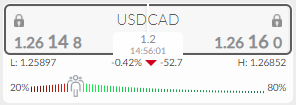
From a sentiment perspective, things look pretty bleak right now. The Activtrader Market Sentiment took shows that traders are still extremely positive towards the USDCAD pair while the price continues to decline. This could be that the pain trade is set to continue until we start to see sentiment towards the USDCAD pair neutralize.
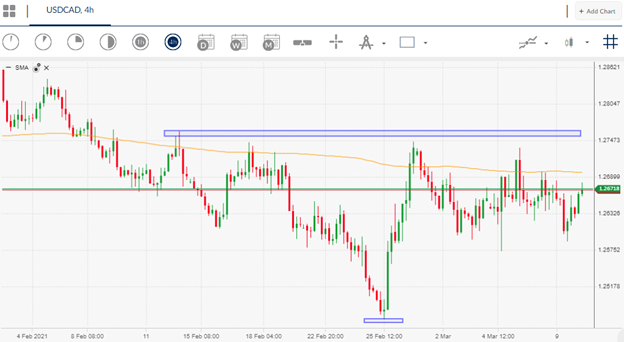
USDCAD Short-Term Technical Analysis
The four-hour time frame shows the short-term trend is bearish while the price trades below the 1.2700 level. This has been a key area that bulls have had surpassing and holding the USDCAD pair above this month.
Another key feature of the mentioned time frame is a large, inverted head and shoulders pattern. The next 300-point move should take place one the 1.2740 to 1.2470 price range is breached.
Bears need to invalidate the pattern below the 1.2470 level, while bulls will need to move the price above the 1.2740 area to trigger the bullish price pattern. Watch out for a major move once this range break occurs.
Source By ActivTrader.
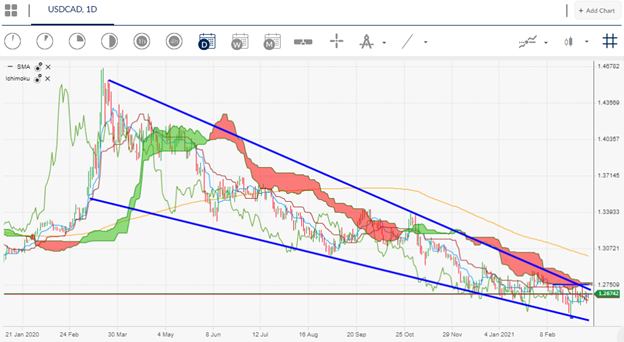
USDCAD Medium-Term Technical Analysis
Looking at the daily time chart, an extremely large falling wedge pattern been in play for nearly one year and continues to dominate the trading action in the medium-term.
Bulls need to move price above the 1.2700 level to activate the pattern. It is worth noting that these patterns have a high degree of accuracy and they have a probability of eventually breaking to the upside. However, this potential breakout has certainly been taking its time.


