The US dollar index staged a huge breakout last week after the FOMC meeting minutes laid the path for a major tapering time announcement at this week’s Jackson Hole Economic Symposium.
After months of being trapped between the 93.50 to 89.50 price range the buck finally picked a direction, and one which may be about to stick if we consider how long the range break has been brewing.
The big question that traders are asking themselves is how far the US dollar travel to the upside before the breakout can starts to pause if indeed a FED taper announcement happens this week.
For the answer to this question we need to go to technical analysis. A bearish head and shoulders pattern with nearly 400 points of downside potential was invalidated last week.
The invalidated price pattern could see, in theory, the US dollar index rallying towards the 97.50 area if we trust the measured target of the invalidated head and shoulders pattern.
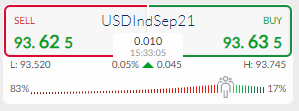
Sentiment is also on the side of bulls. The ActivTrader market sentiment tool is showing that a short squeeze may be brewing amongst the retail crowd as some 83 percent of traders are bearish towards the US dollar index.
Typically, one-way sentiments skews are worrying, and even more so when we see major new trends forming. If we consider the magnitude of last week’s breakout, and if it holds, sentiment is warning us that the herd is too short the greenback.
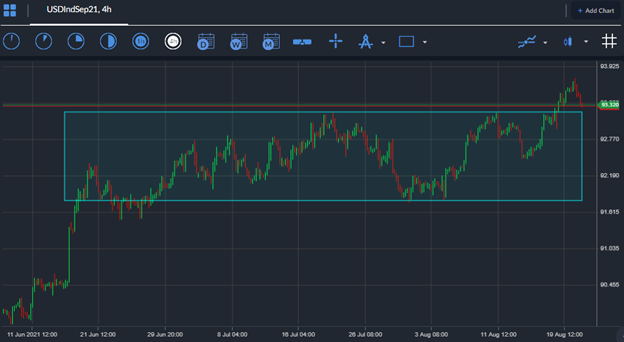
US Dollar Index short-term Technical Analysis
Looking at the four-hour time frame, a small head and shoulders patterns looks to be invalidated after the 93.20 level was broken last week, which effectively invalidates the structure to the pattern.
This week, we could see bulls targeting the 95.00 level if we take the overall size of this pattern and consider that a major higher time frame breakout is in play, which leads us to medium-term analysis.
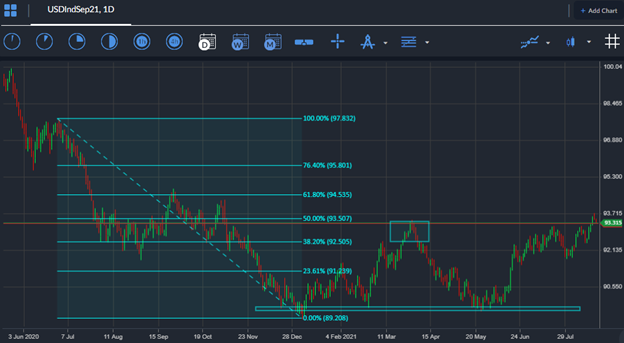
According to the daily time frame a much larger head shoulders pattern has been invalidated and also a bearish triple-top pattern has been invalidated, forming a rectangle breakout.
If we consider the invalidated head and shoulders pattern and the rectangle breakout, we may see a technical test towards the breakout area this week before major lift-off towards the 97.00 area.


