fbpx
High Leverage FX
  • Home
  • Market News
    • All
    • Economy
    • Forex
    • Markets
    • Opinion
    • Politics
    • Tech
    • World
    Asian equities could take a boost after strong gains seen on US equities

    Asian equities may trade on the back foot as traders took profits during Wall Street session

    USDMYR Technical Analysis

    USDMYR Technical Analysis

    Asian equities observe positive start as optimism on Wall Street echoes

    Asian equities could trade with negative bias reflecting caution awaiting Nvidia’s earnings report

    Asian equities could take a boost after strong gains seen on US equities

    Asian equities likely to trade within narrow range following volatile session on Wall Street

    Asian markets may experience volatility as global participants eagerly await significant upcoming events

    Asian markets may experience volatility as global participants eagerly await significant upcoming events

  • Economic Calendar
  • About Us
  • Trading Signals
  • Free Demo Account
High Leverage FX
No Result
View All Result
Home Market News Markets

S&P 500 Technical Analysis – Head & Shoulder Watch

Nathan Batchelor by Nathan Batchelor
February 18, 2022
in Markets
Reading Time: 3 mins read
0
The NY Fed props up the S&P500, as Powell says taper could be as soon as the next meeting
435
SHARES
12k
VIEWS
Share on FacebookShare on Twitter

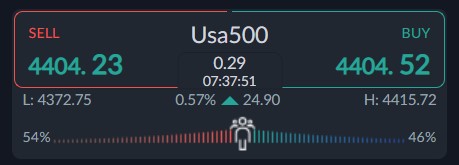
The S&P500 has once again tumbled towards the 4,400-level due to the ongoing Ukraine/Russia tensions and raft of hawkish FED speakers holding a more aggressive stance towards rate increases this week.

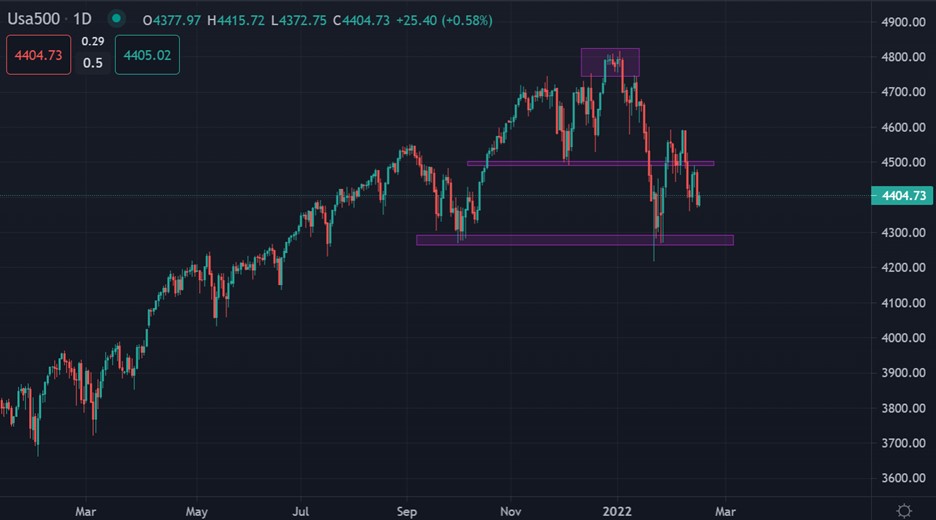
A massive head and shoulders pattern is currently capturing traders’ attention on the S&P500 as it is warning of more heavy losses ahead way below the psychological 4,000 support level.

In terms of the likelihood of this pattern playing out, it really depends on the situation in the Ukraine, and just how bad it could it this conflict spills over into a serious war between western powers.

As things stand, the downside potential is certainly there due to the weakening and technical backdrop, however, we also have to consider that any positive news could cause a major reversal.

Lower time frame analysis shows that a potential double-bottom pattern is forming, so a technical rebound could be on the cards. The price action is also more bullish than one would expect if market participants truly believed a major conflict was going to start.

Something else to consider is market sentiment. That ActivTrader sentiment platform shows that nearly 46 percent of traders are bullish towards this market. I believe this is a negative because negative sentiment is not high as you would expect.

Usually, we should look to fade sentiment extremes, which are currently not there. We probably need to see bearish sentiment to take hold before looking to buy the S&P500.

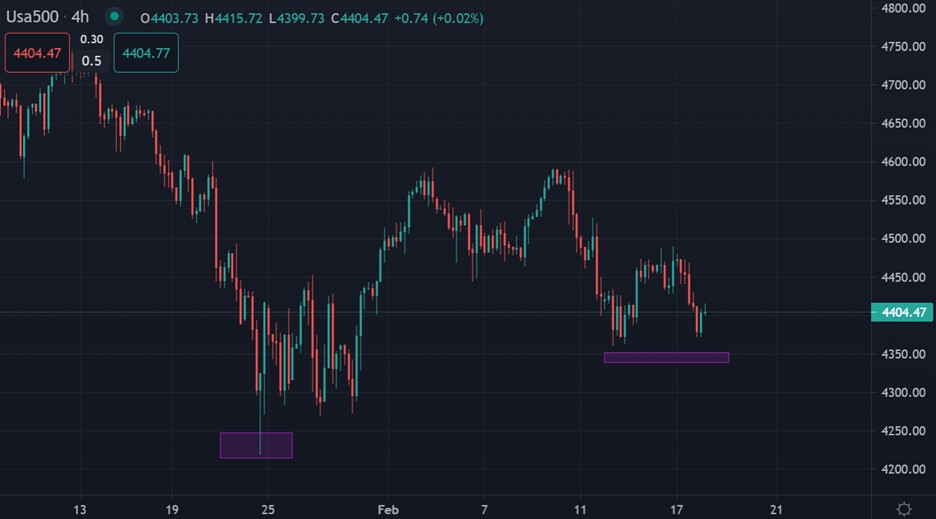
S&P 500 Short-Term Technical Analysis

The four-hour time frame shows that the S&P500 could be forming a major double-bottom pattern, so we do need to bear in the mind the upside risks.

Downside risks are increased if the double-bottom pattern is negated, I would then expect a big drop towards the 3,800-support zone.

See real-time quotes provided by our partner.

S&P 500 Medium-Term Technical Analysis

Looking at the daily time chart, the central focus remains a massive head and shoulders pattern, which is looming large over the S&P500 and threatening to break at any time if the Ukraine conflict worsens.

A move under the 4,200 level is required to activate the massive bearish price patter which holds a 600-point downside target for the S&P500 index.

See real-time quotes provided by our partner.

Tags: FEDRussia-Ukraine tensionsS&P500
Previous Post

Tech and cyclical sectors leading losses after some risks of Russia invading Ukraine

Next Post

Silver Technical Analysis - Starting To Lag Gold

Nathan Batchelor

Nathan Batchelor

Related Posts

Asian equities could take a boost after strong gains seen on US equities
Markets

Asian equities may trade on the back foot as traders took profits during Wall Street session

May 23, 2024
Asian equities observe positive start as optimism on Wall Street echoes
Markets

Asian equities could trade with negative bias reflecting caution awaiting Nvidia’s earnings report

May 23, 2024
Asian equities could take a boost after strong gains seen on US equities
Markets

Asian equities likely to trade within narrow range following volatile session on Wall Street

May 22, 2024
Asian markets may experience volatility as global participants eagerly await significant upcoming events
Markets

Asian markets may experience volatility as global participants eagerly await significant upcoming events

May 21, 2024
Asian equities might experience mixed trading due to profit-taking and anticipation of options expiry trades
Markets

Asian equities might experience mixed trading due to profit-taking and anticipation of options expiry trades

May 17, 2024
Asian equities may experience significant sell-off following the lead of the US
Markets

Asian equities likely to trade positively following significant rally in US stocks and bonds

May 16, 2024
Next Post
Silver Technical Analysis – Starting To Lag Gold

Silver Technical Analysis - Starting To Lag Gold

Leave a Reply Cancel reply

Your email address will not be published. Required fields are marked *


Market Overview

Categories

  • Economy
  • Forex
  • Gadget
  • Markets
  • Opinion
  • Politics
  • RSS Feed
  • Startup
  • Tech
  • Trading Signals
  • Uncategorized
  • World

Site Navigation

  • Home
  • Market News
  • Economic Calendar
  • About Us
  • Trading Signals
  • Free Demo Account
  • Home
  • Market News
  • Economic Calendar
  • About Us
  • Trading Signals
  • Free Demo Account

© 2019 High Leverage FX - All Rights Reserved.

No Result
View All Result
  • Home
  • Market News
    • Forex
    • Economy
    • Opinion
    • World
    • Markets
    • Politics
  • Economic Calendar
  • Trading Signals
  • About Us
  • Free Demo Account
[gtranslate]

© 2019 High Leverage FX - All Rights Reserved.