The New Zealand dollar has recovered from a 12-week trading low against the Japanese yen currency after the New Zealand quarterly inflation report came in much-stronger than expected.
Aside from the strong New Zealand inflation report the NZDJPY pair is also rising due to a lack of action from the Bank of Japan today and the potential for central bank policy divergence to take place.
This leaves plenty of scope for further appreciation in the NZDUSD pair. Policy divergence can be one of the primary tools that fundamental traders use when identifying currency pairs to trade. The technical also looks very attractive for the NZDJPY pair.
Market commentators are noting that the Reserve Bank of New Zealand could be set for a series of hikes this year due to a more bullish tone from the central bank this month, and the fact inflation expectations are rapidly increasing as measures of core inflation in Q2 were at or above the top of the RBNZ’s target band of 1 to 3 percent.
Westpac are calling for a series of coming rate hikes this year while ANZ bank noted “we expect that the OCR will be raised in 25 basis point increments at the August 2021, November 2021, the February, May, August, and November 2022 Monetary Policy Statements, bringing the OCR to 1.75%”,
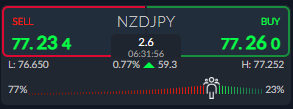
On the sentiment front traders have an increasingly bearish bias towards the NZDJPY pair right now. According to the ActivTrader market sentiment tool some 77 percent of traders are bearish towards the NZDUSD pair.
This should be considered a great sign for bulls as high levels of negative sentiment amongst the retail crowd while the overall trend is bullish could hint that a major short squeeze is coming.
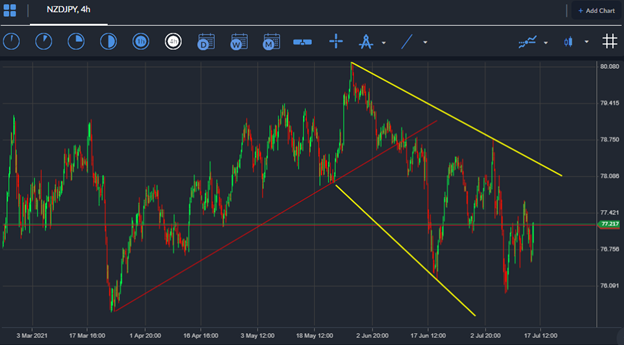
NZDJPY Short-Term Technical Analysis
The four-hour time frame shows that the NZDJPY pair is trading inside a large falling expanding wedge pattern, with bulls needing to move the price above the 78.00 level to force a breakout.
According to size of the pattern a direction move of around 300 points could take place once a breakout above the wedge takes place. It should be noted that falling expanding wedge patterns are amongst the most bullish of reversal pattern.
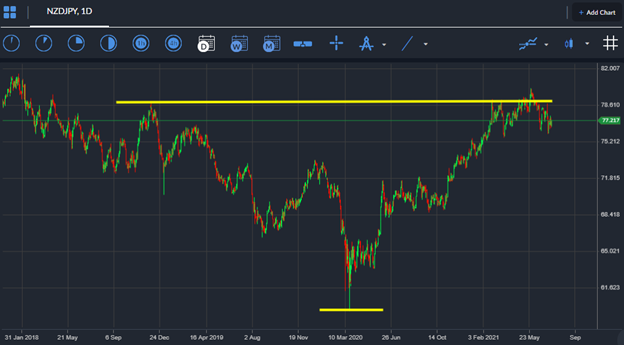
Looking at the daily time chart it appears that an extremely large, inverted head and shoulders pattern has formed, with the bullish price pattern suggesting a potential 1000-point upside move coming for the NZDJPY pair.
Bulls have to move the price back above the 0.7900 level to activate the pattern. Bears beware if the NZDJPY pair stabilizes above the neckline of the mentioned price pattern.


