fbpx
High Leverage FX
  • Home
  • Market News
    • All
    • Economy
    • Forex
    • Markets
    • Opinion
    • Politics
    • Tech
    • World
    Asian equities could take a boost after strong gains seen on US equities

    Asian equities may trade on the back foot as traders took profits during Wall Street session

    USDMYR Technical Analysis

    USDMYR Technical Analysis

    Asian equities observe positive start as optimism on Wall Street echoes

    Asian equities could trade with negative bias reflecting caution awaiting Nvidia’s earnings report

    Asian equities could take a boost after strong gains seen on US equities

    Asian equities likely to trade within narrow range following volatile session on Wall Street

    Asian markets may experience volatility as global participants eagerly await significant upcoming events

    Asian markets may experience volatility as global participants eagerly await significant upcoming events

  • Economic Calendar
  • About Us
  • Trading Signals
  • Free Demo Account
High Leverage FX
No Result
View All Result
Home Market News Forex

Gold Technical Analysis – Trend test

Nathan Batchelor by Nathan Batchelor
December 2, 2022
in Forex
Reading Time: 3 mins read
0
Gold remain steady at $1,800, with investors in “wait and see” mode
487
SHARES
17.2k
VIEWS
Share on FacebookShare on Twitter

Gold has started to rally sharply higher after US Federal Reserve Chair Jerome Powell said smaller interest rate hikes could begin in December, causing the yellow to test the $1,780 level.

Speaking at an event Wednesday, Powell said he expects the central bank will be in a position to reduce the size of rate hikes as soon as next month, which got gold bugs seriously excited.

However, Powell warned that monetary policy is likely to stay restrictive for some time until real signs of progress on inflation emerge, so this statement could also cap the upside in the yellow metal.

A major trend test is now likely as the metal moves towards its trend defining 200-day moving average, which is situated close to the $1,800 resistance level. The price is now only $20.00 away at the time of writing.

Should we see a bullish trend change, and the 200-day moving average broken I suspect we could see gold price headed towards the $1,880 level at some point.

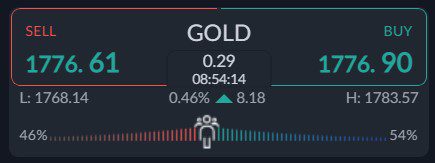
Current sentiment metric towards gold shows that sentiment has become slightly more bullish, which hints that retail are leaning towards more gains this week.

The ActivTrader market sentiment tool shows that 54 percent of traders are bullish towards gold. Going forward, we really need to see a negative bias by retail to help the chances of a sustained recovery.

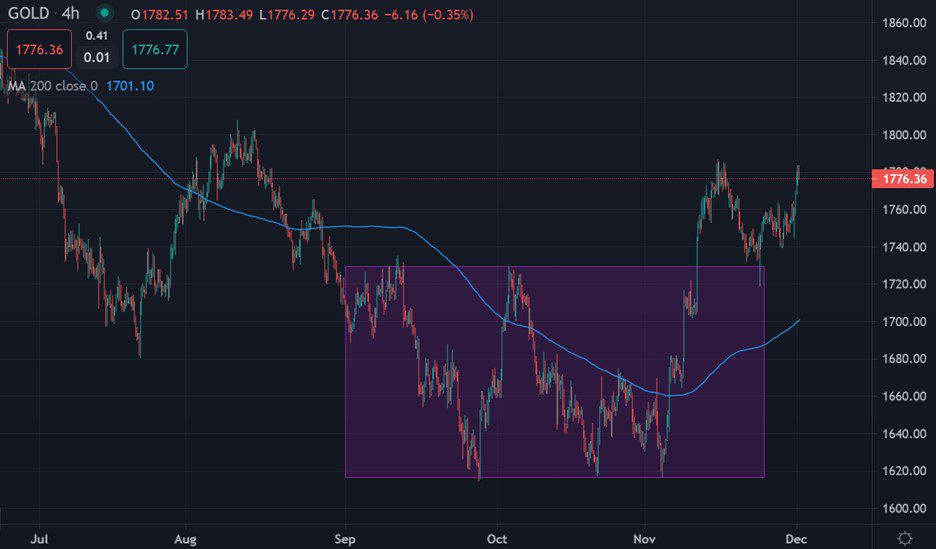
Gold short-term Technical Analysis

According to technical analysis gold the price of gold could be forming a triple double bottom price pattern on the four-hour time frame.

These types of patterns are usually very bullish. Additionally, a head and shoulders type pattern has also been invalidated. More gains towards at least $1,830 seem likely now.

See real-time quotes provided by our partner.

Gold Medium-term Technical Analysis

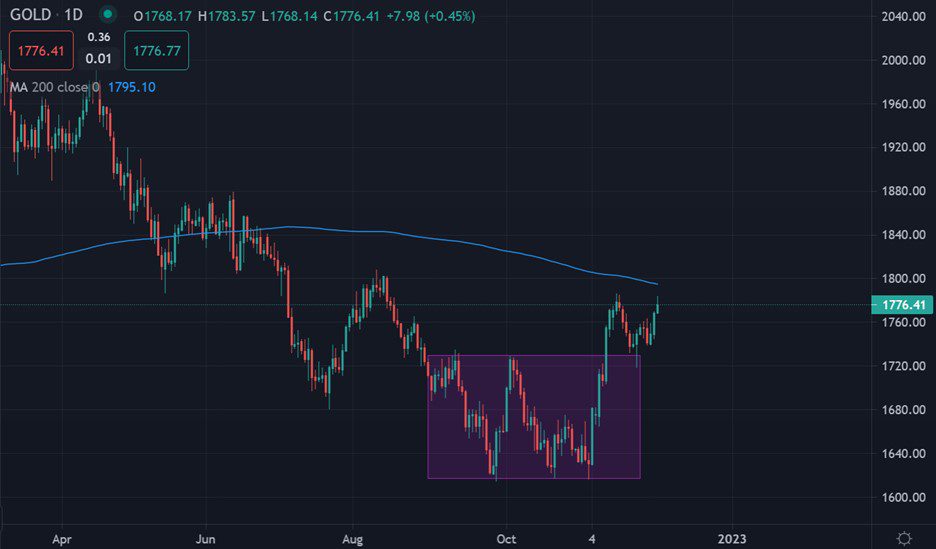
The daily chart shows that the yellow-metal has been steadfastly moving towards its key 200-day moving average, which is found just below the $1,800 price.

We could see the price of gold revisit this metric at any time. It is very important that the $1,800 level is broken this week or a drop towards the $1,750 level could happen again.

See real-time quotes provided by our partner.

Tags: FEDGoldJerome PowellRate hikes
Previous Post

Morning Brief - Nonfarm Payrolls Preview

Next Post

The Week Ahead

Nathan Batchelor

Nathan Batchelor

Related Posts

USDMYR Technical Analysis
Forex

USDMYR Technical Analysis

May 23, 2024
USD/MYR Technical Analysis
Forex

USDMYR Technical Analysis

May 17, 2024
USDMYR Technical Analysis
Forex

USDMYR Technical Analysis

May 15, 2024
USDMYR Technical Analysis
Forex

USDMYR Technical Analysis

May 9, 2024
USDMYR Technical Analysis
Forex

USDMYR Technical Analysis

May 8, 2024
Forex Technical Analysis – Malaysian Ringgit
Forex

USDMYR Technical Analysis

May 7, 2024
Next Post
The Week Ahead

The Week Ahead

Leave a Reply Cancel reply

Your email address will not be published. Required fields are marked *


Market Overview

Categories

  • Economy
  • Forex
  • Gadget
  • Markets
  • Opinion
  • Politics
  • RSS Feed
  • Startup
  • Tech
  • Trading Signals
  • Uncategorized
  • World

Site Navigation

  • Home
  • Market News
  • Economic Calendar
  • About Us
  • Trading Signals
  • Free Demo Account
  • Home
  • Market News
  • Economic Calendar
  • About Us
  • Trading Signals
  • Free Demo Account

© 2019 High Leverage FX - All Rights Reserved.

No Result
View All Result
  • Home
  • Market News
    • Forex
    • Economy
    • Opinion
    • World
    • Markets
    • Politics
  • Economic Calendar
  • Trading Signals
  • About Us
  • Free Demo Account
[gtranslate]

© 2019 High Leverage FX - All Rights Reserved.