Gold had a wild week on the precious metals market last week as the yellow-metal fell to a new yearly trading low and then reversed all of its early-week losses to actually close the week in the green.
The much weaker US consumer sentiment survey pushed back the markets expectation that the Federal Reserve is going to announce tapering at the upcoming Jackson Hole meeting.
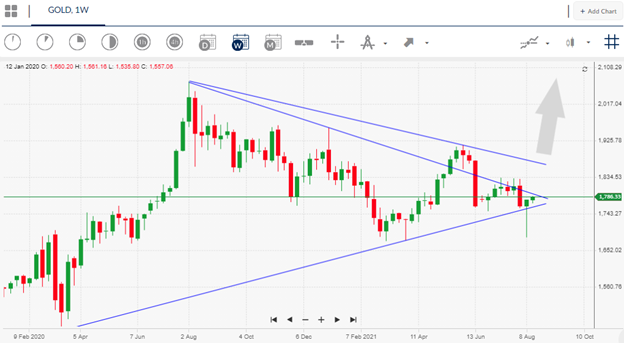
In fact, the technicals are very bullish for gold because a bullish weekly hammer candle formed last week. The last time a hammer candle formation took place on the weekly time frame gold rallied from $1,700 to $1,900.
It is worth pointing out that last week’s hammer pattern is ever more bullish because the hammer candle closed in the green, offering a clear buy signal and a sign that buying interest is strong.
Whether gold is going to rally significantly prior to Jackson Hole remains to be seen and will largely be data dependant ahead of the important central bank meeting. With that said I am cautiously bullish towards QE remaining in place due to the high COVID-19 infection rate, and the recent series of soft data points from the US economy.
Sentiment towards gold is also looking good. Last week bullish sentiment was close to eighty percent, however, bullish sentiment has dropped significantly, which is something I have been watching out for.
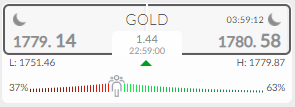
The ActivTrader market sentiment tool shows that 63 percent of traders are still bullish towards gold. This is a good sign as not too many traders are bullish, meaning that the long trade is not that overcrowded yet.
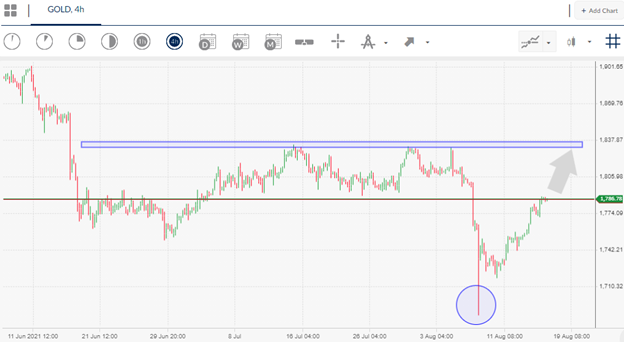
Gold short-term Technical Analysis
The short-term technicals for the yellow-metal shows that a massive, inverted head and shoulders pattern will start to take shape if the price can recover towards the $1,830 price zone.
Looking at the weekly resistance zones, I think $1,800 and $1,810 levels offer the strongest form of resistance prior to the $1,830 level.
According to the weekly time frame has formed a bullish hammer candle, which usually suggests strong buying interest and an intention for an asset class to head higher.
While there is no guarantee that gold is heading higher the fundamentals, sentiment, and technical are aligning, which bodes well for a medium-term push back towards the $2,100 resistance zone.


