Gold has staged a fairly significant rally in the aftermath of the May Fed meeting, after Federal Reserve Chair Jerome Powell ruled out a 75-basis-point rate hike at upcoming meetings, contradicting market expectations for June.
Fed chair Powell made his comments during a scheduled press conference on Wednesday after implementing the biggest interest rate hike for the United States since the year 2000.
While additional 50bps increases are on the table at the next couple of meetings according to the Fed chair, the committee will make their decisions meeting by meeting as the access the incoming data.
The USA economy is likely to be a big deal in terms of what the market is looking closely at, especially since recent data showed that the U.S. economy contracted 1.4% in the first quarter.
Gold made a strong bounce from the $1,850 level recently, which could hint that a meaningful price bottom has formed, and that gold could start to cement itself back above the $1,925 level, which was a key technical pivot from last month.
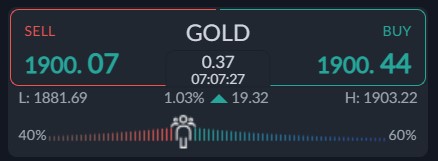
Current sentiment metric towards gold show that traders are bullish, but not overly bullish towards the price of gold The ActivTrades market sentiment tool shows that 60 percent of traders are bullish towards gold.
With this not so strong sentiment bias it is neither bullish nor bearish gold prices, as retail are not euphoric in either direction. However, it should be noted that bullish sentiment has dropped by nearly 30 percent since late April.
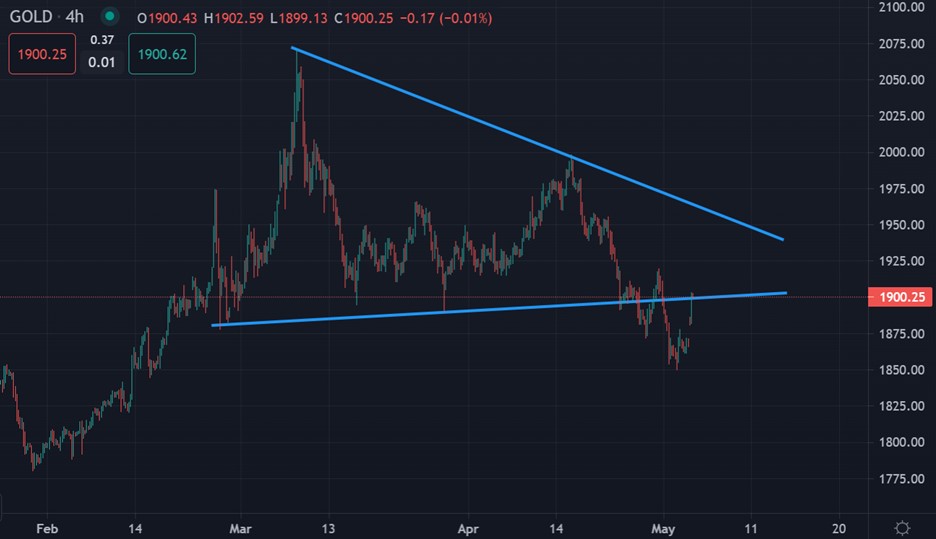
Gold short-term Technical Analysis
The short-term technicals for the yellow-metal shows that a technical pullback appears to be done following what looks like a false breakout from a large symmetrical triangle pattern.
Looking at the well-denoted pattern on the four-hour price chart, a coming price bounce towards the towards the tops of the triangle seems likely. Keep your eye on the $1,950 resistance zone.
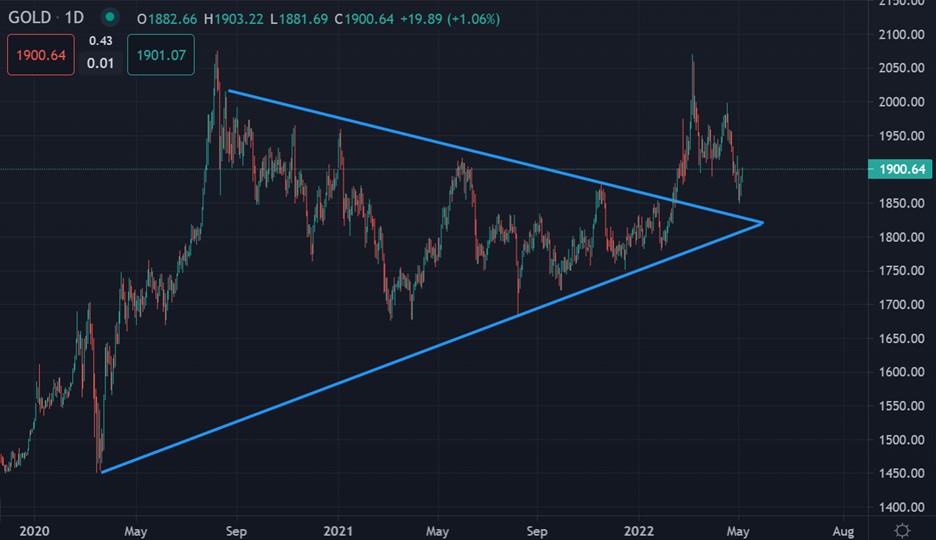
The daily chart shows that gold remains a strong buy while trading above the $1,830 level, which is the location of a key former breakout from a huge triangle pattern.
I expect that the price correction in gold is now done, and we could see further upside towards the $1,925 resistance level, and finally the $2,000.