Gold is starting to test back towards the $1,830 technical area after bouncing from critical $1,780 support and also being aided by the recent downside move in the US dollar index.
The yellow metal is increasingly technical, and this has been a constant theme in the battle between gold bulls and bears around the $1,800 technical zone, which is proving a sticking point.
One of the reasons why gold is at a sticking point is the 200-day moving average, which is located around the $1,800. The next major move away from the 200-day MA will be a big deal for technical traders who are currently indecisive towards the yellow-metal.
I suspect the events in Ukraine, and indeed the moves in the US dollar index are going to dictate the price action and next major directional move for precious metals such as gold.
We should also consider that seasonal trends are likely to be negative for gold over the coming months. Gold had a terrible February and March last year, so do keep an eye on that.
As we move into February, which was a terrible month for gold last year, we do have to be aware of the Beijing Olympics, and Ukraine as reasons why gold is indecisive in the interim.
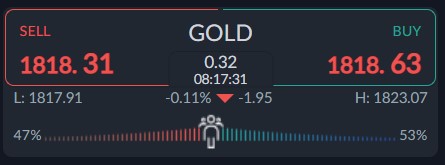
Sentiment is also a good metric to watch right now. The current sentiment metric towards gold highlights indecision. The ActivTrader market sentiment tool shows that 53 percent of traders are bullish towards gold.
This is a big leap down move from last week. Traders remained bullish towards for the most part of last year, despite its soft performance after January. I would be mindful that sentiment is dropping, so it could be bullish.
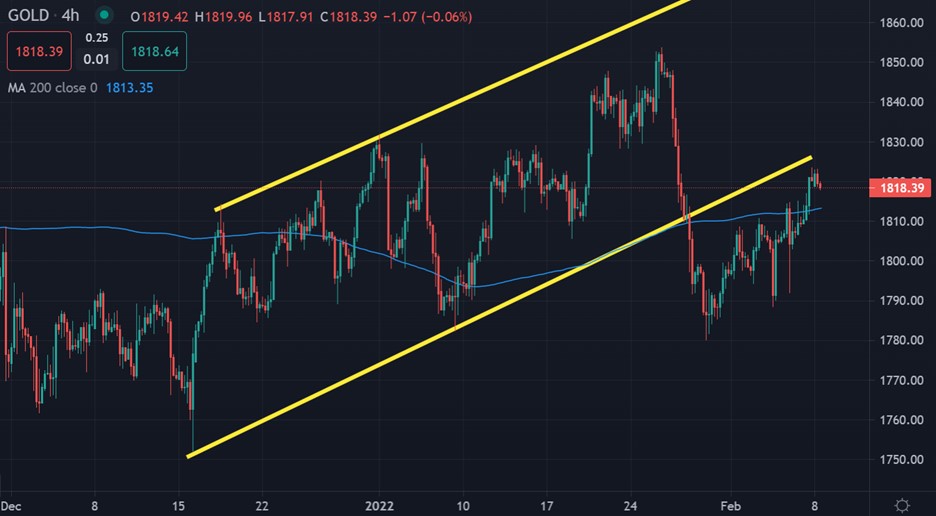
Gold short-term Technical Analysis
The short-term technicals for the yellow metal on the four-hour time frame show that bears have broken under a key rising wedge pattern, and the price of gold is moving back towards the wedge.
Overall, the short-term technical are clear, A bullish bias is expected while the price trades above the $1,830 level, while the next leg lower should be expected below the $1,780 support level.
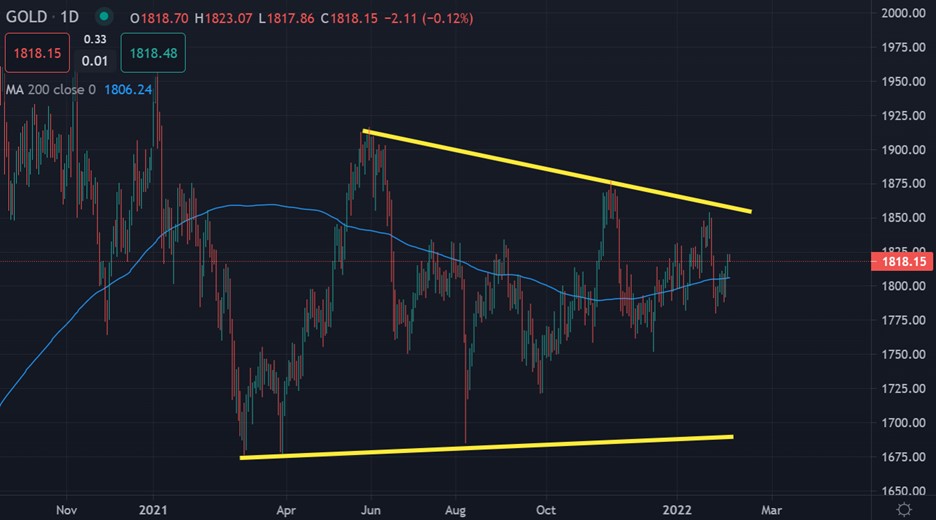
The daily weekly chart shows show that the yellow metal is trapped inside a massive wedge pattern, and is closer to the top of the wedge, that it is the bottom.
As simply put as possible, the daily chart is showing that the next major move should happen once we start to see daily price movement past the $1,850 to $1,780 price range.


