fbpx
High Leverage FX
  • Home
  • Market News
    • All
    • Economy
    • Forex
    • Markets
    • Opinion
    • Politics
    • Tech
    • World
    Asian equities could take a boost after strong gains seen on US equities

    Asian equities may trade on the back foot as traders took profits during Wall Street session

    USDMYR Technical Analysis

    USDMYR Technical Analysis

    Asian equities observe positive start as optimism on Wall Street echoes

    Asian equities could trade with negative bias reflecting caution awaiting Nvidia’s earnings report

    Asian equities could take a boost after strong gains seen on US equities

    Asian equities likely to trade within narrow range following volatile session on Wall Street

    Asian markets may experience volatility as global participants eagerly await significant upcoming events

    Asian markets may experience volatility as global participants eagerly await significant upcoming events

  • Economic Calendar
  • About Us
  • Trading Signals
  • Free Demo Account
High Leverage FX
No Result
View All Result
Home Market News Forex

Gold Medium-term Technical Analysis

Nathan Batchelor by Nathan Batchelor
July 21, 2022
in Forex
Reading Time: 3 mins read
0
Gold Medium-term Technical Analysis
456
SHARES
14.4k
VIEWS
Share on FacebookShare on Twitter

Gold has failed to stage a bounce, despite the US dollar index moving lower for three straight now and being well away from its 20-year high that it set during the previous trading week.

Traders looking for a buy signal in the yellow metal have little to go on as buy volumes appear light, and the rebound from below the $1,700 support level has so far been tepid at best.

However, it should be noted that gold did test towards the bottom of multi-year range from March 2020 last week, and sellers failed to stage a meaningful breakthrough under this key technical area.

If sellers continue to struggle to break under the $1,700 level then it is entirely possible that we could be about to see a major bounce back in the price of gold towards at least $1,790.

Should we see a range break under the $1,700 level then the consequences for gold price is quite dire. Gold could tumble by a further $200.00 if a range break did occur according to technical analysis.

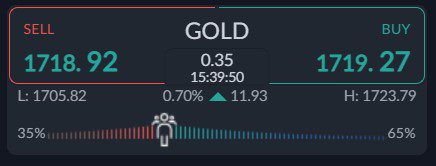
Sentiment is dropping slightly now. The sentiment skew is getting less extreme, which is a positive force for a potential. recovery in the price of gold this week.

Current sentiment metric towards gold show that traders are getting less bullish. The ActivTrader market sentiment tool shows that 65 percent of traders are bullish towards gold.

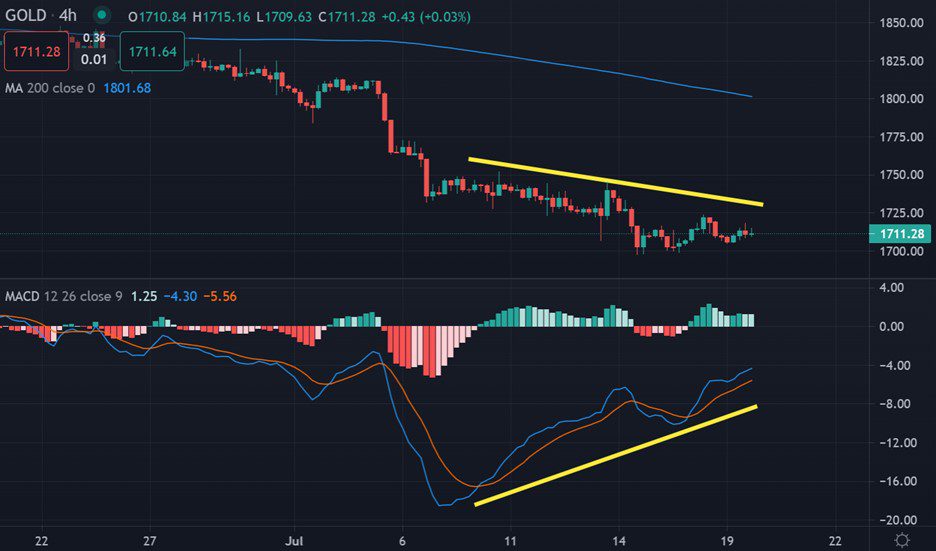
Gold short-term Technical Analysis

The short-term technicals for the yellow metal are still very bearish, however, a glimmer of hope exists as significant amount of negative price divergence has started to form.

Looking at the MACD price divergence, we could see the price of gold rallying towards the $1,750 level if the positive MACD price divergence starts to unwind.

See real-time quotes provided by our partner.

Gold Medium-term Technical Analysis

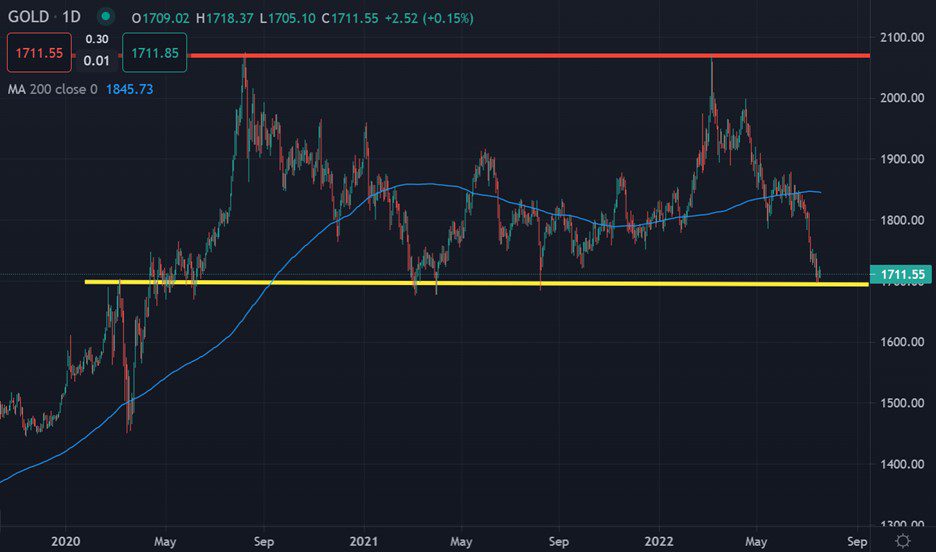
The daily chart shows that gold has now officially tested towards the bottom of its price range. As you can see the top of the range is basically $2,050, while the bottom is slightly below $1,700.

A break under the range would be a huge problem for gold and would indicate that a $300.00 down move could happen. It is very important that the price of gold continues to rebound now.

See real-time quotes provided by our partner.

Tags: GoldUS Dollar index
Previous Post

EURGBP Technical Analysis - Headed to 0.8600 level

Next Post

USDMYR Technical Analysis

Nathan Batchelor

Nathan Batchelor

Related Posts

USDMYR Technical Analysis
Forex

USDMYR Technical Analysis

May 23, 2024
USD/MYR Technical Analysis
Forex

USDMYR Technical Analysis

May 17, 2024
USDMYR Technical Analysis
Forex

USDMYR Technical Analysis

May 15, 2024
USDMYR Technical Analysis
Forex

USDMYR Technical Analysis

May 9, 2024
USDMYR Technical Analysis
Forex

USDMYR Technical Analysis

May 8, 2024
Forex Technical Analysis – Malaysian Ringgit
Forex

USDMYR Technical Analysis

May 7, 2024
Next Post
USDMYR Technical Analysis

USDMYR Technical Analysis

Leave a Reply Cancel reply

Your email address will not be published. Required fields are marked *


Market Overview

Categories

  • Economy
  • Forex
  • Gadget
  • Markets
  • Opinion
  • Politics
  • RSS Feed
  • Startup
  • Tech
  • Trading Signals
  • Uncategorized
  • World

Site Navigation

  • Home
  • Market News
  • Economic Calendar
  • About Us
  • Trading Signals
  • Free Demo Account
  • Home
  • Market News
  • Economic Calendar
  • About Us
  • Trading Signals
  • Free Demo Account

© 2019 High Leverage FX - All Rights Reserved.

No Result
View All Result
  • Home
  • Market News
    • Forex
    • Economy
    • Opinion
    • World
    • Markets
    • Politics
  • Economic Calendar
  • Trading Signals
  • About Us
  • Free Demo Account
[gtranslate]

© 2019 High Leverage FX - All Rights Reserved.