fbpx
High Leverage FX
  • Home
  • Market News
    • All
    • Economy
    • Forex
    • Markets
    • Opinion
    • Politics
    • Tech
    • World
    Asian equities could take a boost after strong gains seen on US equities

    Asian equities may trade on the back foot as traders took profits during Wall Street session

    USDMYR Technical Analysis

    USDMYR Technical Analysis

    Asian equities observe positive start as optimism on Wall Street echoes

    Asian equities could trade with negative bias reflecting caution awaiting Nvidia’s earnings report

    Asian equities could take a boost after strong gains seen on US equities

    Asian equities likely to trade within narrow range following volatile session on Wall Street

    Asian markets may experience volatility as global participants eagerly await significant upcoming events

    Asian markets may experience volatility as global participants eagerly await significant upcoming events

  • Economic Calendar
  • About Us
  • Trading Signals
  • Free Demo Account
High Leverage FX
No Result
View All Result
Home Market News Markets

GER40 Technical Analysis – Bollinger band mean reversion

Nathan Batchelor by Nathan Batchelor
March 3, 2022
in Markets
Reading Time: 3 mins read
0
GER40 Technical Analysis – Bollinger band mean reversion
415
SHARES
12.1k
VIEWS
Share on FacebookShare on Twitter

The German DAX had a terrible February, with the leading German index breaking under the 15,000-support level and eventually tumbling towards the 13,800-support region.

Many other European indices are recovering on the first day of March despite the Ukraine crisis, however, the GER40 is still vulnerable to further monthly losses after February’s bearish price close.

Technical analysis shows a clear case of mean reversion. Meaning, that when price gets overstretched in one direction it often reverts back to the mean price as traders reprice the asset.

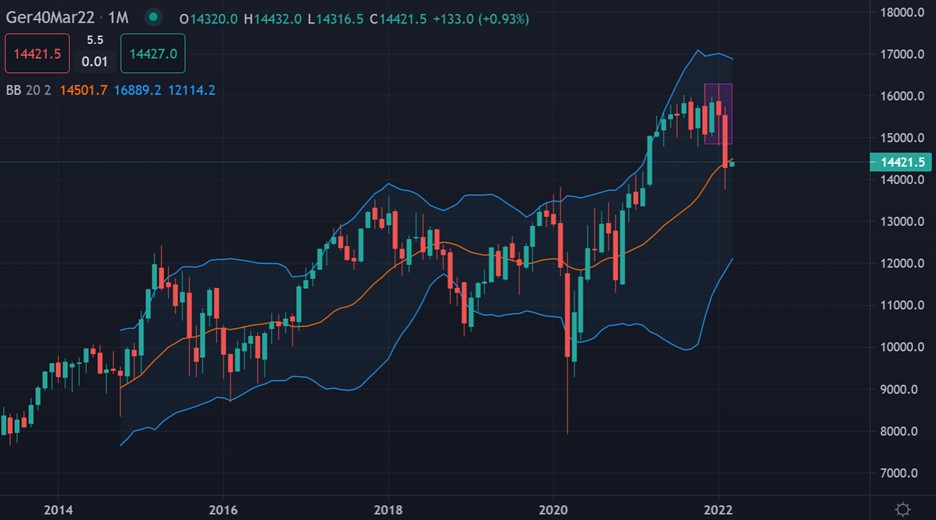
The Bollinger Band indicator is a wonderful indicator for mean reversion strategy. The GER40 has recently moved back to the mean on the monthly time frame, meaning mid-Bollinger Band.

This sets up an interesting dynamic for March, as the GER40 is no longer overbought and could be fair value at current levels. As always, the asset will either drift towards the lower or upper band now, after reverting backing to the mean.

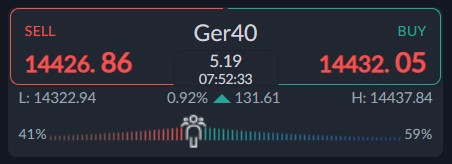
Looking at sentiment towards the DAX, a bullish bias is still in play with 59 percent of traders expecting more gains. This provides the conditions for a continuation of the downtrend, as retail traders are still bullish.

Overall, if bears are able to get past the 13,800-support zone in the coming trading days and weeks it should be raising a red flag for more losses GER40. Sentiment is pointing to more losses.

GER40 Technical Analysis

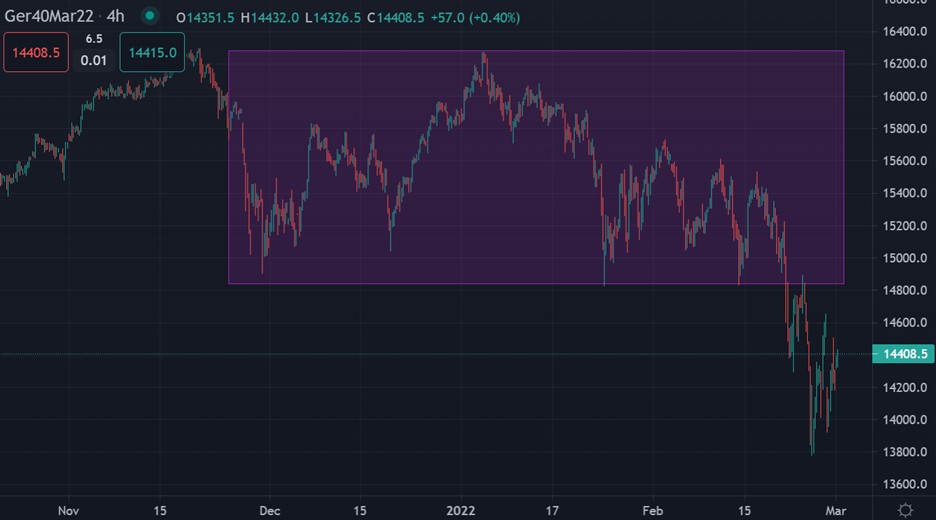
The GER40 index has activated a large head and shoulders pattern on the four-hour time frame but has yet to meet its downside projection. This usually means a continuation of the directional move is still going to take place until the target is hit..

Should we see the lower continue, then I think we could see the 13,500-support level reached, to complete the final target of the bearish pattern.

See real-time quotes provided by our partner.

The monthly time frame shows that the German DAX has formed a series of bearish lower highs and lower lows, while the Bollinger Band indicator shows the GER40 has reached the mid-line.

The final confirmation needed for a medium-term sell signal is sustained moving around from the medium band, meaning that mean reversion to the downside is underway.

See real-time quotes provided by our partner.

Tags: DAX40Russia-Ukraine Crisis
Previous Post

Asia equities begin the week on the front foot after talks between Russia and Ukraine

Next Post

Russian fighting intensifies sending oil to 9-year highs

Nathan Batchelor

Nathan Batchelor

Related Posts

Asian equities could take a boost after strong gains seen on US equities
Markets

Asian equities may trade on the back foot as traders took profits during Wall Street session

May 23, 2024
Asian equities observe positive start as optimism on Wall Street echoes
Markets

Asian equities could trade with negative bias reflecting caution awaiting Nvidia’s earnings report

May 23, 2024
Asian equities could take a boost after strong gains seen on US equities
Markets

Asian equities likely to trade within narrow range following volatile session on Wall Street

May 22, 2024
Asian markets may experience volatility as global participants eagerly await significant upcoming events
Markets

Asian markets may experience volatility as global participants eagerly await significant upcoming events

May 21, 2024
Asian equities might experience mixed trading due to profit-taking and anticipation of options expiry trades
Markets

Asian equities might experience mixed trading due to profit-taking and anticipation of options expiry trades

May 17, 2024
Asian equities may experience significant sell-off following the lead of the US
Markets

Asian equities likely to trade positively following significant rally in US stocks and bonds

May 16, 2024
Next Post
Brent Crude Technical Analysis – Can bulls hold the $75.00 level?

Russian fighting intensifies sending oil to 9-year highs

Leave a Reply Cancel reply

Your email address will not be published. Required fields are marked *


Market Overview

Categories

  • Economy
  • Forex
  • Gadget
  • Markets
  • Opinion
  • Politics
  • RSS Feed
  • Startup
  • Tech
  • Trading Signals
  • Uncategorized
  • World

Site Navigation

  • Home
  • Market News
  • Economic Calendar
  • About Us
  • Trading Signals
  • Free Demo Account
  • Home
  • Market News
  • Economic Calendar
  • About Us
  • Trading Signals
  • Free Demo Account

© 2019 High Leverage FX - All Rights Reserved.

No Result
View All Result
  • Home
  • Market News
    • Forex
    • Economy
    • Opinion
    • World
    • Markets
    • Politics
  • Economic Calendar
  • Trading Signals
  • About Us
  • Free Demo Account
[gtranslate]

© 2019 High Leverage FX - All Rights Reserved.