The German DAX has started to recover due to more tones towards the new COVID-19 strain, which looks to be less deadly after the index dipped towards the 15,100-level last Friday.
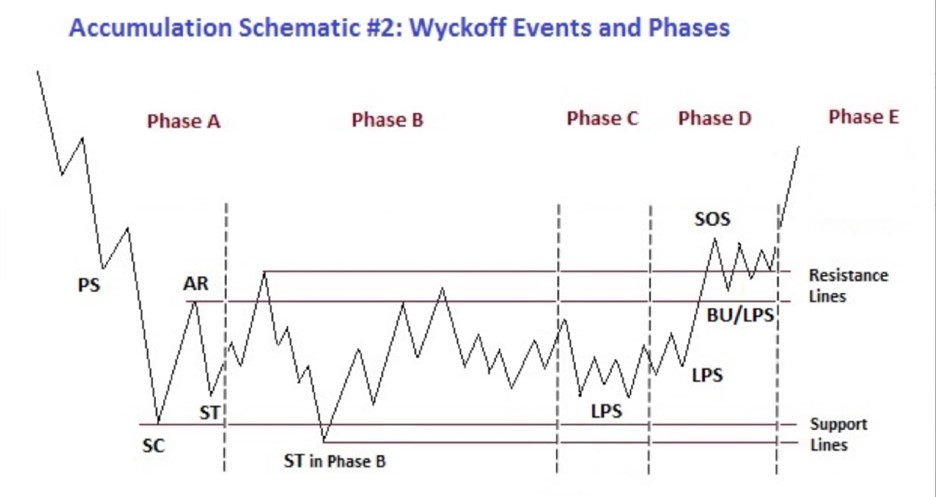
As I mentioned last week technical analysis is currently showing that a Wyckoff accumulation pattern may is forming over the lower time frames. It now looks almost certain that a Phase 2 Wyckoff accumulation schematic method is playing out.
Therefore, the German DAX could be preparing to surge higher. According to the overall objective of the Wyckoff method. Phase 2, the recent low around 15,000 had to hold, and when it did, a massive near 400-point bounce has occurred.
Currently, the Phase 2 Wyckoff accumulation schematic method looks to be in the LPS phase. If bulls can breach the 15,500 level, or the recent important swing high from late November, then a massive breakout is coming.
Source – Stockcharts.com
Phase 2 confirmation comes past the 15,500 level, therefore this would mean that a major breakout for the German DAX towards the 16,000 level is in sight as a wider recovery commences.
Overall, traders should expect gains if we see the 16,000-level broken, with the 16,300 and 16,600 levels the major upside targets. Failure to move past 15,800 should be considered a warning sign.
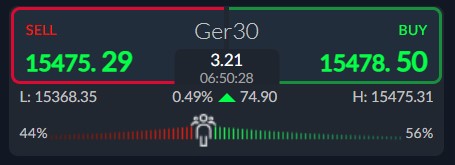
Looking at sentiment towards the DAX, a slight bullish bias is in play with 56 percent of traders expecting more gains. This is the ideal conditions for a major market rally, as traders are not too bullish, despite the huge 500-point recovery from the lows of last the month.
GER30 Technical Analysis
The four-hour time frame shows we are currently seeing the Wyckoff phase 2 method starting to unfold, following bears failure to make a major new trading low last Friday. I believe the 15,800 level is the key upside breakout level to watch now.
The daily time frame shows that the German DAX bounced from its lower Bollinger Band. Therefore, according to technical analysis the German DAX could consolidate around 15,800 level or the mid Bollinger Band.
This would make a lot of sense, and this often happens with this indicator. For the record, the upper daily Bollinger Band is around 16,600. A rally towards the upper Bollinger Band is also possible.


