The British pound has had a soft start to the week against the Japanese yen currency, with the pair sliding back towards the 153.00 support zone, despite a promising price rally towards the 155.00 resistance level last.
Broad based weakness in the British pound and bouts of strength in the Japanese yen currency are currently triggering pullbacks in the GBPJPY pair. This ongoing dynamic is running counter trend, as the yen has been weak against most major currencies recently, while the British pound has traded above its 200-day moving average against the yen since November 2020.
The Japanese yen is worth keeping an eye on this month as yen weakness could become a dominant theme. The bearish fundamentals surrounding the Japanese economy could come home to roost.
The GBPJPY pair has formed bullish MACD price divergence during its current weekly decline, meaning that the GBPJPY pair could be ready to bounce back sharply. The bullish divergence extends towards the 154.50 area.
From a technical perspective the GBPJPY pair is on the cusp of breaking out into a much higher trading range. The first step is for bulls would be for them to take-out to 155.00 level, which would mark a breakout from descending broadening wedge pattern.
The second step would be for bulls to break above the 2018 trading high, around the 156.50 level. If buyers can break above this key high then a massive, inverted head and shoulders pattern will be activated. This could catapult the GBPJPY pair into a much higher trading range.
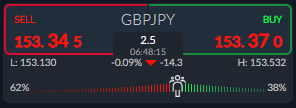
The ActivTrader Market Sentiment tool shows that some 62 percent of traders are bearish towards the GBPJPY pair right now. This bodes well for a strong recovery in the short-term. Historical data has shown that fading one-sentiment skews amongst the retail crowd has proved to be lucrative.
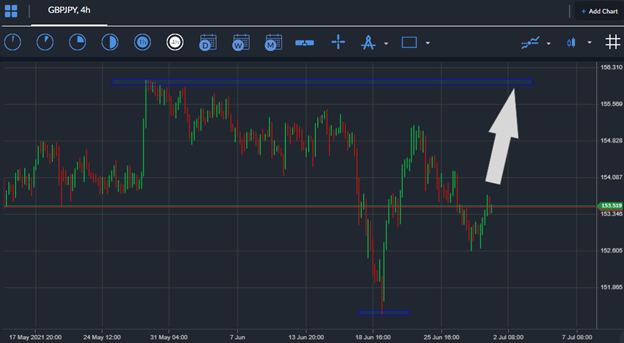
GBPJPY Short-Term Technical Analysis
The four-hour time frame shows that a bullish descending expanding wedge pattern has formed and is present between the 153.00 and 155.00 level. These wedge patterns are typically considered to be amongst the most bullish reversal patterns.
Buyers have repeatedly struggled to move the price above the top of the mentioned wedge pattern. Interestingly, if bulls can move the price above the 155.00 level then a powerful rally towards the 157.00 level should be expected.
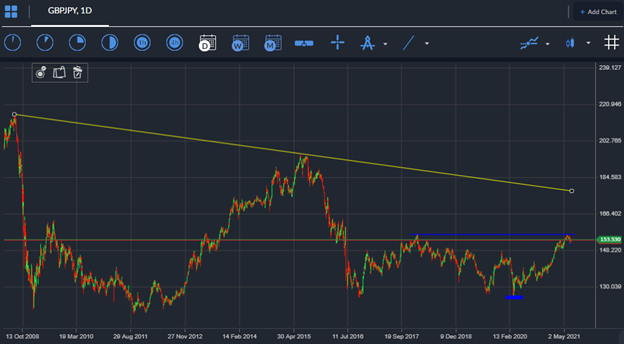
Looking at the daily time chart shows that the GBPJPY pair has formed a huge head and shoulders pattern towards the bottom of its historical trading range, between the 125.00 to 156.50 level.
If the pattern is invalidated and plays out to its full upside potential then a huge rally towards the 1.8000 level could happen over the medium to long-term horizon. In the near-term a breakout above the 156.50 level is highly possible.


