fbpx
High Leverage FX
  • Home
  • Market News
    • All
    • Economy
    • Forex
    • Markets
    • Opinion
    • Politics
    • Tech
    • World
    Asian equities could take a boost after strong gains seen on US equities

    Asian equities may trade on the back foot as traders took profits during Wall Street session

    USDMYR Technical Analysis

    USDMYR Technical Analysis

    Asian equities observe positive start as optimism on Wall Street echoes

    Asian equities could trade with negative bias reflecting caution awaiting Nvidia’s earnings report

    Asian equities could take a boost after strong gains seen on US equities

    Asian equities likely to trade within narrow range following volatile session on Wall Street

    Asian markets may experience volatility as global participants eagerly await significant upcoming events

    Asian markets may experience volatility as global participants eagerly await significant upcoming events

  • Economic Calendar
  • About Us
  • Trading Signals
  • Free Demo Account
High Leverage FX
No Result
View All Result
Home Market News Forex

EURUSD Technical Analysis – Watch the Bollinger Bands

Nathan Batchelor by Nathan Batchelor
February 16, 2021
in Forex, Opinion
Reading Time: 3 mins read
0
EURUSD Technical Analysis – Watch the Bollinger Bands
220
SHARES
5.7k
VIEWS
Share on FacebookShare on Twitter

The euro currency has had a slow start to the new trading week against the US dollar, due to the Presidents Day Holiday in the United States reducing the market action on the foreign exchange market.

Periods of extended sideways price consolidation after often followed by explosive technical breakouts on the currency market, and indeed this is what the Bollinger Band indicator on the four-hour time frame is currently suggesting.

Typically, when the Bollinger Band indicator start to narrow, for example when the upper and lower Bollinger Bands start to tighten, major directional moves often follow. A good rule of thumb is that the higher the time frame that price consolidation and a tightening of the bands occurs, then the more explosive the break will likely be.

Something else to note is the EURUSD pair’s Average True Range indicator on the daily time frame is at its lowest level since March 2020. The Average True Range is basically a measure of the average trading range over a designated period of time.

The ATR indicator on the daily time frame is currently around 60, which means the Average daily range is around 60 pips. The ATR indicator has been trending lower since June last year and could well be because the euro currency is increasingly being used as a funding currency.

Aside from the technical factors, the release of eurozone PMI manufacturing data from the German economy, the FOMC meeting minutes, US Retails Sales, and US Manufacturing data all have the ability to cause such a breakout this week.

Although, I should note that the average weekly ATR for the EURUSD pair has dropped to around 150 points. The Average Weekly ATR was around 220 points in May last year and has been gradually declining since this period.

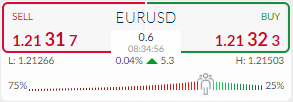
Looking at retail positioning, things look particularly bullish for the EURUSD pair right now. The ActivTrader Market Sentiment tool shows that some 75 percent of traders are bearish towards the euro right now.    

The bearish skew has increased since last week, meaning that the chances of a long squeeze have also increased. Watch out for the recent recovery to continue while bearish sentiment remains this high.                          

EURUSD Short-Term Technical Analysis

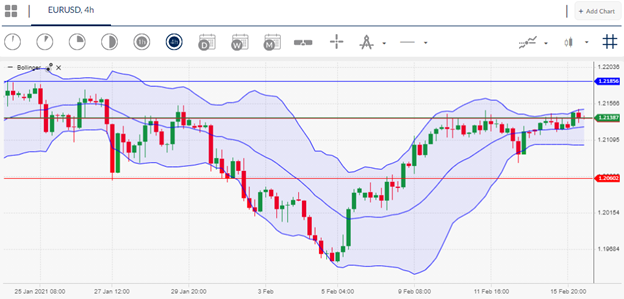
According to the Bollinger Band indicator on the four-hour time the EURUSD pair is trapped between the upper and lower bands, around the 1.2100 and 1.2150 levels, As mentioned earlier, a big breakout is looming, due to a major tightening of the bands.

Traders looking for exposure to the breakout should wait for a convincing move either side of the four-hour Bollinger Bands. Additionally, watch out for fake moves and reversal from either Bollinger Bands if the four-hour range continue to decline.

Source By ActivTrader.

EURUSD Medium-Term Technical Analysis

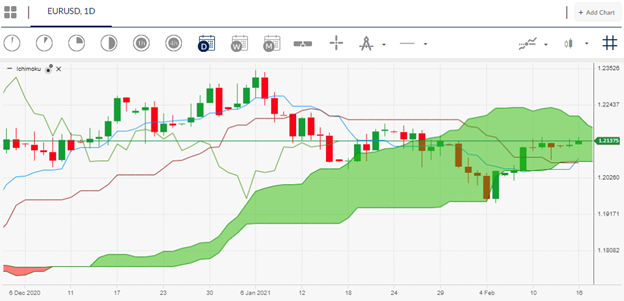
Looking at the daily time chart the EURUSD pair is still trapped inside a large rising price channel. We should expect the EURUSD pair to test towards the top of the channel all the while that the bottom of the channel is defended.

Due to the fact that the channel is rising, it means that trendline support is also rising. As long bulls continue to defend the bottom of the channel then the chances increase that the EURUSD pair will bounce towards the top of the channel.

The Ichimoku indicator also shows that the EURUSD pair is working through cloud resistance. This basically means that the upside resistance is likely to be slow until the cloud is surpassed.

Source By ActivTrader.

Tags: Eur/Usd
Previous Post

The reflation game

Next Post

German DAX Technical Analysis - 15,000 Target

Nathan Batchelor

Nathan Batchelor

Related Posts

USDMYR Technical Analysis
Forex

USDMYR Technical Analysis

May 23, 2024
USD/MYR Technical Analysis
Forex

USDMYR Technical Analysis

May 17, 2024
USDMYR Technical Analysis
Forex

USDMYR Technical Analysis

May 15, 2024
USDMYR Technical Analysis
Forex

USDMYR Technical Analysis

May 9, 2024
USDMYR Technical Analysis
Forex

USDMYR Technical Analysis

May 8, 2024
Forex Technical Analysis – Malaysian Ringgit
Forex

USDMYR Technical Analysis

May 7, 2024
Next Post
German DAX Technical Analysis – 15,000 Target

German DAX Technical Analysis - 15,000 Target

Leave a Reply Cancel reply

Your email address will not be published. Required fields are marked *


Market Overview

Categories

  • Economy
  • Forex
  • Gadget
  • Markets
  • Opinion
  • Politics
  • RSS Feed
  • Startup
  • Tech
  • Trading Signals
  • Uncategorized
  • World

Site Navigation

  • Home
  • Market News
  • Economic Calendar
  • About Us
  • Trading Signals
  • Free Demo Account
  • Home
  • Market News
  • Economic Calendar
  • About Us
  • Trading Signals
  • Free Demo Account

© 2019 High Leverage FX - All Rights Reserved.

No Result
View All Result
  • Home
  • Market News
    • Forex
    • Economy
    • Opinion
    • World
    • Markets
    • Politics
  • Economic Calendar
  • Trading Signals
  • About Us
  • Free Demo Account
[gtranslate]

© 2019 High Leverage FX - All Rights Reserved.