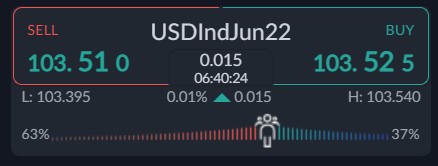
The US dollar index is consolidating around the 103.50 level ahead of today’s Fed meeting, after the index reached its highest level since January 2017 early this week and threatens to break to a 20-year high.
Ahead of today’s Fed meeting the buck is threatening a huge technical breakout. If we see the US dollar index holding above the 2020 and 2017 highs, we could see the US dollar index breaking out into a much, much higher trading range.
Worryingly, FX analysts at ING still think it is too early to pick the top in the US dollar rally given the prospect of aggressive tightening and the challenging global environment for risk.
ING analysts note “Even if the Fed-induced strength might appear more limited now that an aggressive tightening cycle has been priced in, an external environment where markets find other key non-US markets unattractive.”
They also added that “China due to lockdowns, Europe due to geopolitical risk, other emerging markets due to tightening financial conditions) offers quite a solid floor to the dollar.
I tend to agree, and with central bank divergence, and a growth remaining study in the United States, it is therefore possible we will see more greenback strength against other major currencies after the Fed’s decision.
According to the ActivTrader Market Sentiment tool some 63% of traders are bearish towards the US dollar index, which may hint those further gains are coming as bearish sentiment is growing.
This is bullish constrain signal is pointing to more USD gains, however, it should be noted that bullish sentiment has dropped around 13 percent since last week, which could hint that the downside is going to slow.
US dollar index Short-Term Technical Analysis
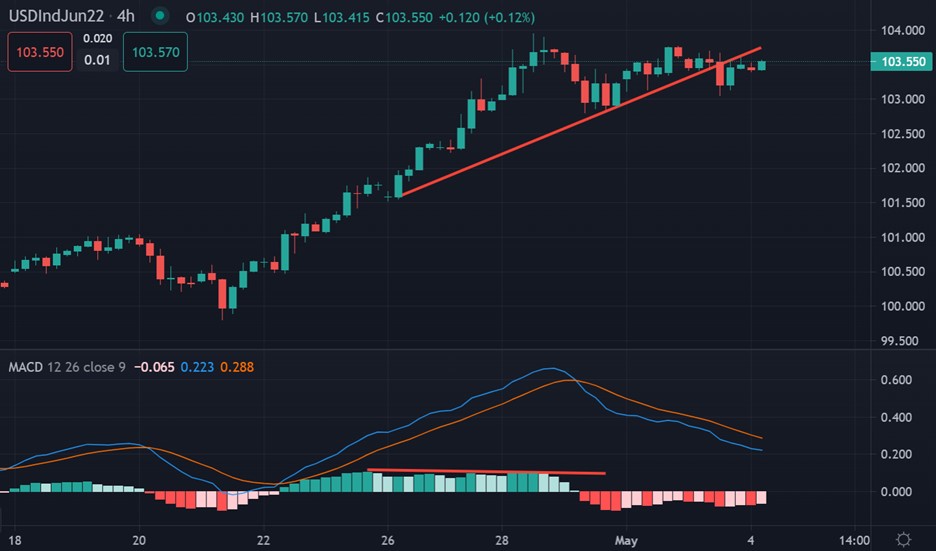
Technical analysis on the four-hour time frame shows that the US dollar index pair has started to base out around the 103.55 level, after bulls failed to clear the 104.00 resistance level.
Large amounts of negative MACD price divergence have also formed on the four-hour time frame. According to the overall size of the bearish divergence, it shows that the US dollar index could be preparing to stage a move towards the 101.50 support area.
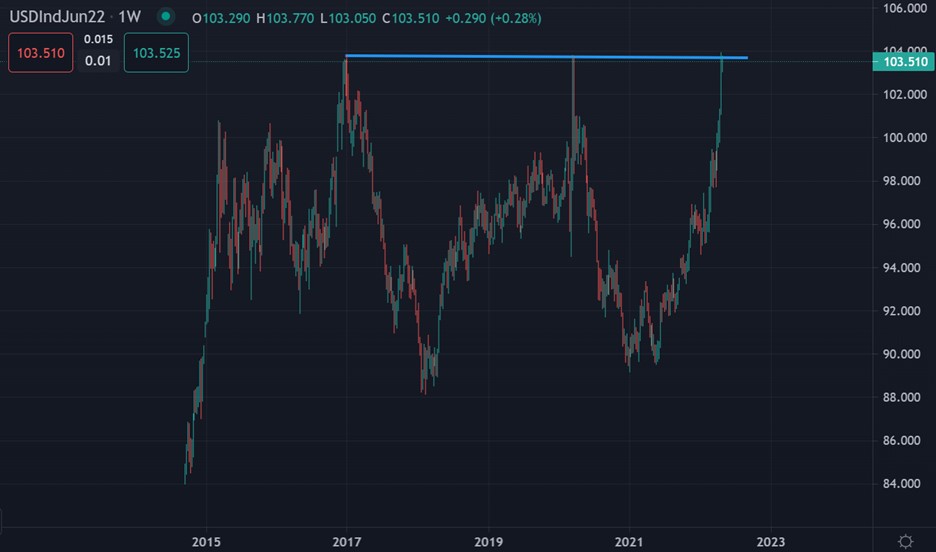
The weekly time frame is showing that US dollar index has briefly breached a key multi-year trendline. A move past the 2017 high would be a signal pointing to more strong price gains ahead.
An eventual breach of a multi-year trendline resistance, around the 104.00 area seems to be on the cards. A break above the trendline would turbocharge a surge in the US dollar index.


