fbpx
High Leverage FX
  • Home
  • Market News
    • All
    • Economy
    • Forex
    • Markets
    • Opinion
    • Politics
    • Tech
    • World
    Asian equities could take a boost after strong gains seen on US equities

    Asian equities may trade on the back foot as traders took profits during Wall Street session

    USDMYR Technical Analysis

    USDMYR Technical Analysis

    Asian equities observe positive start as optimism on Wall Street echoes

    Asian equities could trade with negative bias reflecting caution awaiting Nvidia’s earnings report

    Asian equities could take a boost after strong gains seen on US equities

    Asian equities likely to trade within narrow range following volatile session on Wall Street

    Asian markets may experience volatility as global participants eagerly await significant upcoming events

    Asian markets may experience volatility as global participants eagerly await significant upcoming events

  • Economic Calendar
  • About Us
  • Trading Signals
  • Free Demo Account
High Leverage FX
No Result
View All Result
Home Market News Markets

Dow Jones Industrial Average Technical Analysis – Sell Signals Remain

Nathan Batchelor by Nathan Batchelor
October 13, 2021
in Markets
Reading Time: 3 mins read
0
Dow Jones Industrial Average Technical Analysis – Sell Signals Remain
407
SHARES
9.2k
VIEWS
Share on FacebookShare on Twitter

The Dow Jones Industrial Average remains one of the most fascinating trades at the moment, as the index, which is a proxy for the real economy, continues to tread water around the 34,000 to 35,000 level.

Currently the tape is bearish, meaning that the price action surrounding the DJIA is not hinting at a recovery in the heavily industrially weighted index. More to the point, a number of sell signal remain in force.

However, even with these sell signals in place, such as the Parabolic SAR on the daily time frame, the trend is still bullish. The index bounced sharply from its 200-day moving average earlier this month and remains firmly above it

It must be said that even with an energy crisis emerging, high inflation, the threat of tapering, consumers spending less as they deal with the impact of COVID-19 and the highly contagious delta variant, the index is still relatively well supported.

We probably need to see a major range break of the October high to low before we see a clear path in the Dow Jones Industrial Average. I feel with earnings season, and the potential for tapering to be delayed, we could see an upside surprise.

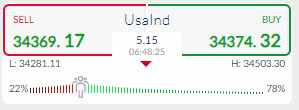
Sentiment towards the index is extremely bullish at the moment. The ActivTrader Market Sentiment tool shows that some 78 percent of traders are currently positive towards further gains in the DJIA.

I feel it may be difficult for the DJIA to rally give the high levels of bullish sentiment towards the index, especially since retail traders are often on the wrong side of the market and have poor market timing.

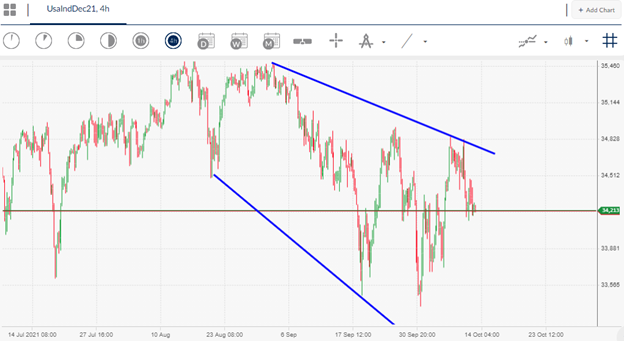
Dow Jones Industrial Average Short-Term Technical Analysis

The four-hour time frame continues to show that a large falling broadening expanding wedge pattern is in play. These patterns are typically amongst the most bullish reversal patterns.

As things stage, a move above the 35,600 level is needed for a breakout from the wedge. If a breakout does happen the index could go parabolic towards a new all-high.

See real-time quotes provided by our partner.

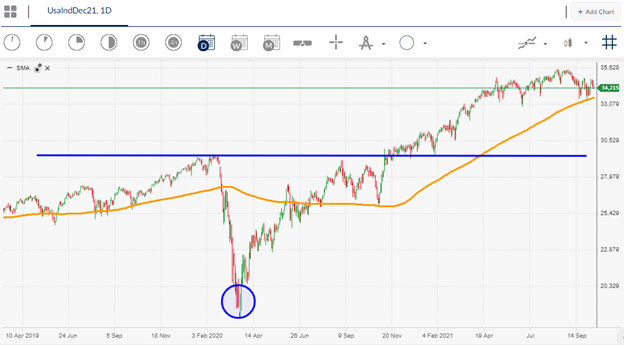
Dow Jones Industrial Average Medium-Term Technical Analysis

Looking at the daily time frame, the trend is still bullish, and the bigger picture continues to show that massive, inverted head and shoulders pattern play out to the upside.

According to the overall size of the pattern the DJIA could just be warming up, as the final target for the mentioned price pattern would take the index towards the 39,600 area.

Expect further gains in this index while the 200-day moving average is well defended. Until then, buying low and close to the 200-day is the top strategy.

See real-time quotes provided by our partner.

Tags: Dow Jones
Previous Post

FTSE 100 Technical Analysis - 7,140 Is the big breakout level to watch

Next Post

USD/MYR, USD/CNY Technical Analysis

Nathan Batchelor

Nathan Batchelor

Related Posts

Asian equities could take a boost after strong gains seen on US equities
Markets

Asian equities may trade on the back foot as traders took profits during Wall Street session

May 23, 2024
Asian equities observe positive start as optimism on Wall Street echoes
Markets

Asian equities could trade with negative bias reflecting caution awaiting Nvidia’s earnings report

May 23, 2024
Asian equities could take a boost after strong gains seen on US equities
Markets

Asian equities likely to trade within narrow range following volatile session on Wall Street

May 22, 2024
Asian markets may experience volatility as global participants eagerly await significant upcoming events
Markets

Asian markets may experience volatility as global participants eagerly await significant upcoming events

May 21, 2024
Asian equities might experience mixed trading due to profit-taking and anticipation of options expiry trades
Markets

Asian equities might experience mixed trading due to profit-taking and anticipation of options expiry trades

May 17, 2024
Asian equities may experience significant sell-off following the lead of the US
Markets

Asian equities likely to trade positively following significant rally in US stocks and bonds

May 16, 2024
Next Post
USD/MYR, USD/CNH Technical Analysis

USD/MYR, USD/CNY Technical Analysis

Leave a Reply Cancel reply

Your email address will not be published. Required fields are marked *


Market Overview

Categories

  • Economy
  • Forex
  • Gadget
  • Markets
  • Opinion
  • Politics
  • RSS Feed
  • Startup
  • Tech
  • Trading Signals
  • Uncategorized
  • World

Site Navigation

  • Home
  • Market News
  • Economic Calendar
  • About Us
  • Trading Signals
  • Free Demo Account
  • Home
  • Market News
  • Economic Calendar
  • About Us
  • Trading Signals
  • Free Demo Account

© 2019 High Leverage FX - All Rights Reserved.

No Result
View All Result
  • Home
  • Market News
    • Forex
    • Economy
    • Opinion
    • World
    • Markets
    • Politics
  • Economic Calendar
  • Trading Signals
  • About Us
  • Free Demo Account
[gtranslate]

© 2019 High Leverage FX - All Rights Reserved.