The Dow Jones Industrial Average has been having another volatile trading week amid lingering concerns about the delta variant’s impact on the United States economy, following last week’s dovish jobs report.
Due to its link with the real economy, the Dow Jones Industrial Average is the choice for traders who want to get out of stock that could take the biggest hit from a decline in economic growth.
A number of large investment banks have also come out and reduced growth forecasts, which has caused sentiment to take a hit. Goldman Sachs downgraded its economic outlook over the weekend, citing the delta variant and fading fiscal stimulus.
Goldman cut its fourth-quarter GDP outlook to 5.5%, down from 6.5%, while Morgan Stanley downgraded U.S. equities to underweight on Tuesday. This was a big negative catalyst for traders this week.
Morgan Stanley said, “We see a bumpy September-October as the final stages of a mid-cycle transition play out,” and “the next two months carry an outsized risk to growth, policy and the legislative agenda.”
Heavyweight stocks inside the DJIA also took a big hit, such as Boeing, whose shares were lower after the Wall Street Journal reported deliveries for the 787 Dreamliner would likely be further delayed.
The VIX CBOE Volatility Index is one to watch if the DJIA takes a big hit and has been relatively depressed as it holds below 20. Typically, volatility spikes can catch traders off-guard, and to be honest, we probably need to see the S&P 500 and Nasdaq falling alongside the DJIA to really induce fear.
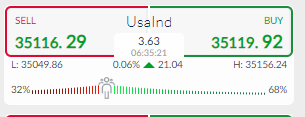
Sentiment towards the index is worryingly bullish at the moment. The ActivTrader Market Sentiment tool shows that some 68 percent of traders are currently bullish towards the DJIA, despite the recent price pullback.
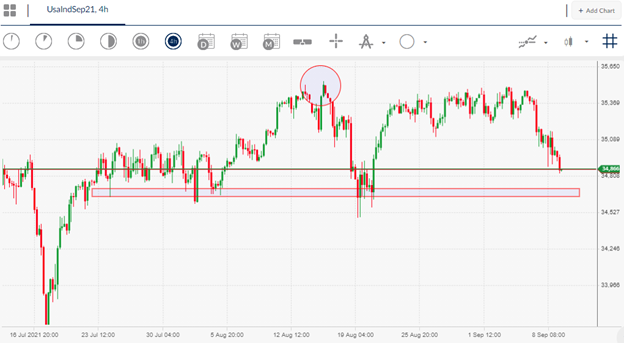
Dow Jones Industrial Average Short-Term Technical Analysis
The four-hour time frame shows that a bearish head and shoulders pattern has formed, following the recent sharp reversal from the 35,600-resistance level.
According to technical analysis the pattern will be activated if the price drops under the 34,700-support level. The size of the pattern implies that a drop towards the 34,000 level could be forthcoming.
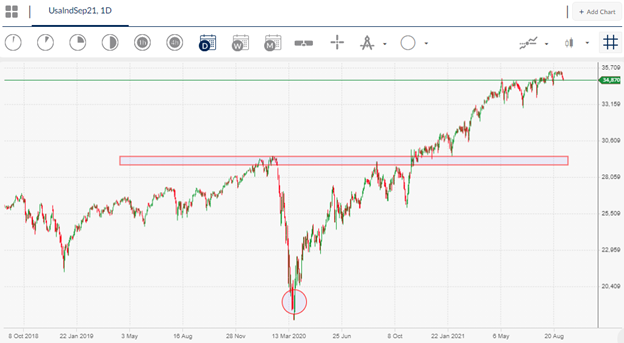
Dow Jones Industrial Average Medium-Term Technical Analysis
Looking at the daily and weekly time frame, i.e. the larger picture, the technical outlook remains extremely positive while the price trades above the 29,550 level. This area is important because it marks the neckline of a large, inverted head and shoulders pattern.
The overall upside projection of the bullish pattern is suggesting an eventual move towards the 40,000-resistance level.
However, the move higher is likely to remain volatility, and a pullback does seem likely along the way before DJIA moves towards its overall upside target.