The US dollar is once breaking higher against the Japanese yen currency ahead of a pivotal week for the USDJPY pair, the Fed meeting and the ongoing breakout in the US dollar index to new multi-year highs.
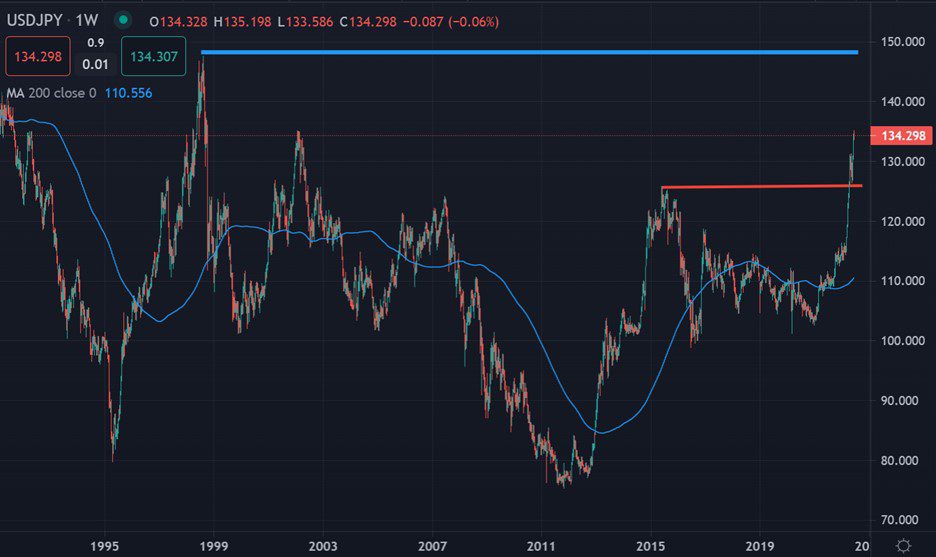
With the USDJPY pair approaching the 135.00 area traders are naturally debating just how high the USDJPY pair can actually go. The price chart on the weekly time frame clearly show the 150.00 level as huge resistance.
Traders are also debating that the Bank of Japan is going to start to raise interest rates and inflation moves higher in Japan. This previously drove much USDJPY speculation, however the BOJ recently squashed the rumors.
Economists at MUFG Bank believe that the pair could climb as high as 140.00, which is short of 150.00 prediction, but certainly plausible given that the price is nearly at 135.00 at least.
MUFG note that the “The break above 2002 highs at 135.15 provides a further bullish signal for the USD/JPY in the near-term and could trigger an acceleration of yen weakness by encouraging speculation of a return to the highs during the Asian Financial Crisis when it last climbed above the 140.00-level.”
The Bank also add that “Overall the fundamental developments continue to favour further yen weakness it the near-term, but market participants will be more wary of the risk of intervention and/or a hawkish shift in BoJ policy in the week ahead.”
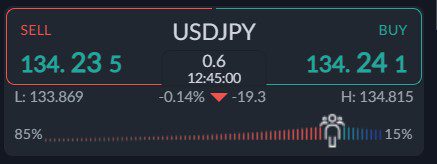
According to the ActivTrader Market Sentiment tool shows that some 85% of traders are bearish towards the USDJPY pair. This is good for the upside in the USDJPY pair and could prompt more upside.
Considering that the pair is breaking towards the 134.00 level, and the huge sentiment bias, I think we could probably see more upside ahead in the USDJPY pair towards the 140.00 area or even a as high as 150.00.
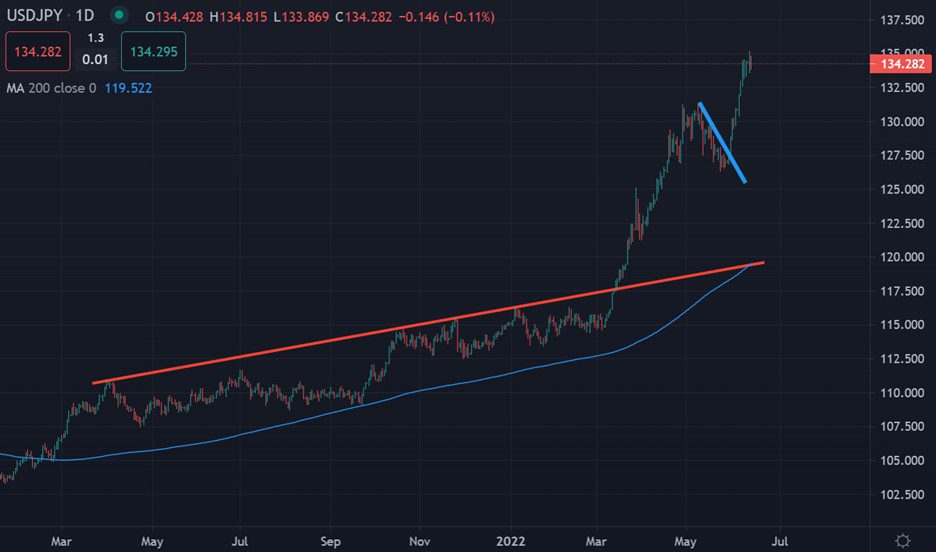
USDJPY Medium-Term Technical Analysis
Technical analysis on the daily time frame shows that the USDJPY pair has started to go parabolic after moving above its 200-day MA, and then breaking away from the 12000 range.
The USDJPY pair certainly looks like it activated a bullish inverted head and shoulders pattern, with the pattern activated are breaking above the 131.50 resistance level this month.
The weekly time frame is showing that the USDJPY pair has recovered towards the 2000 high, with the 137.00 level the most notable peak before the actual 150.00 level itself.
It is also noteworthy that the price is above the 200-week MA, which really gives a strong buy signal and indication that the USDJPY pair could be about to breakout even further.


