The British pound currency fell to its lowest trading level since September 2020 on Monday, due to fears over a Beijing lockdown and another bout of strong US dollar index buying.
It is still too early to know whether this is the start of a big breakdown in the British pound currency, especially since Signs that the UK economy is under stress from soaring inflation have emerged.
Last week the British pound suffered from a very bad retail sales report, with the GBPUSD witnessing aggressive follow-through selling for the third successive day at the start of this week.
Aggressive Fed rate hike bets, with the Federal Reserve and the Bank of England due to meet next week. Additionally, the BoE hinted that it may need to be very careful with domestic the economy, and they currently can’t raise rates further.
A lot with also depend on the US dollar index over the next few days, as the DXY approaches multi-year highs. A breakthrough the highs of March 2020 or rejection will be the clue.
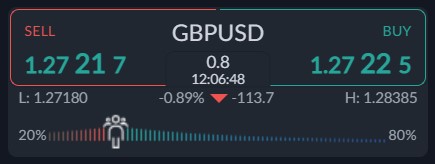
Looking at sentiment data and how traders feel about sterling, the ActivTrader Market Sentiment tool shows that traders are currently slightly bullish towards sterling.
With 80% of traders turning bullish, it should be noted that this current sentiment reading is warning of more losses, as traders have basically taken a very bullish view since the 1.2900 level.
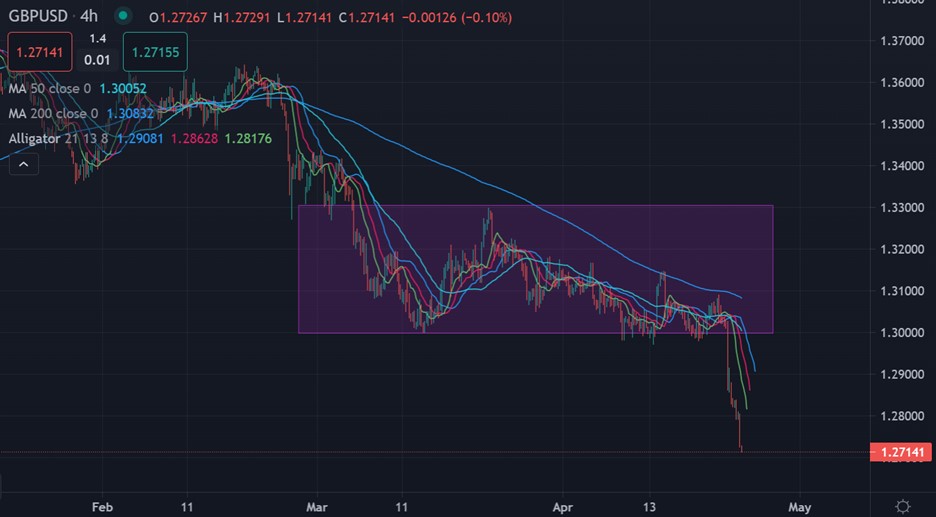
GBPUSD Short-term Technical Analysis
Looking at the four-hour time frame, technical analysis clearly shows that that GBPUSD pair has ignited a large head and shoulders pattern, with the pattern reaching its full downside projection.
A strong bounce back from the 1.2700 level is required now, with a recovery back towards the 1.3300 level helping the cement a large bullish reversal pattern. Much under the 1.2700 level and 1.2550 is then key.
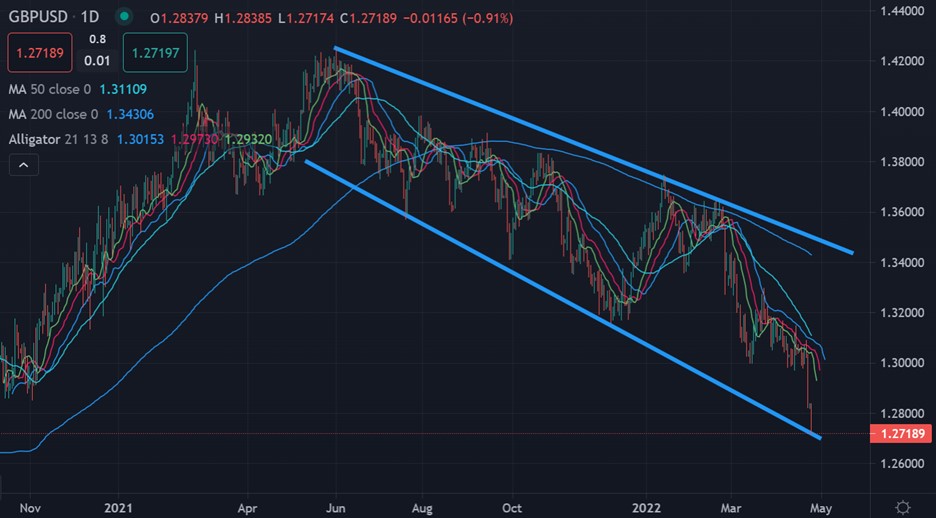
According to the daily time frame, the GBPUSD pair has reached the bottom of a declining broadening expanding wedge pattern, which is a basically a bullish reversal pattern.
A daily time frame close under the wedge could cause a huge price collapse, while a rebound from this 1.2700 level could cause a major rebound to the middle of the pattern, around the 1.3150 level.


