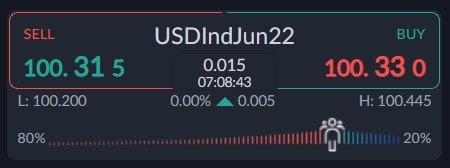
The US dollar index has been firming above the 100.00 level this week as the buck benefits from risk-off trading sentiment and an increased expectation of a 50-basis point rate hike from the FED next week.
The latest Consumer Price Index report from the United States, which measures the prices of a basket of goods and services measured at 8.5%, the fastest pace of annual inflation in 40 years.
Driven up by continuing supply chain problems, soaring demand and rising energy prices, prices in the US climbed at their highest rates since 1981, as the war in Ukraine drove up energy costs for Americans, the labour department announced on Tuesday.
This clearly speak about the need for the FED to continue to hike rates ahead as the US central bank attempt to stop US inflation hitting double-digits. This is further bullish for the US dollar.
With central bank divergence, and a growth remaining study it is therefore a recipe for more greenback strength against other major currencies. The EURUSD pair is close to breaking down below the 1.0800 level, which would only serve to accelerate further upside in the US dollar index.
According to the ActivTrader Market Sentiment tool some 80% of traders are bearish towards the US dollar index, which may hint those further gains are coming as bearish sentiment is growing.
This is another bullish constrain signal, which is pointing to more USD gains, and we should also consider that while bond yields are breaking out this is further supportive for USD gains.
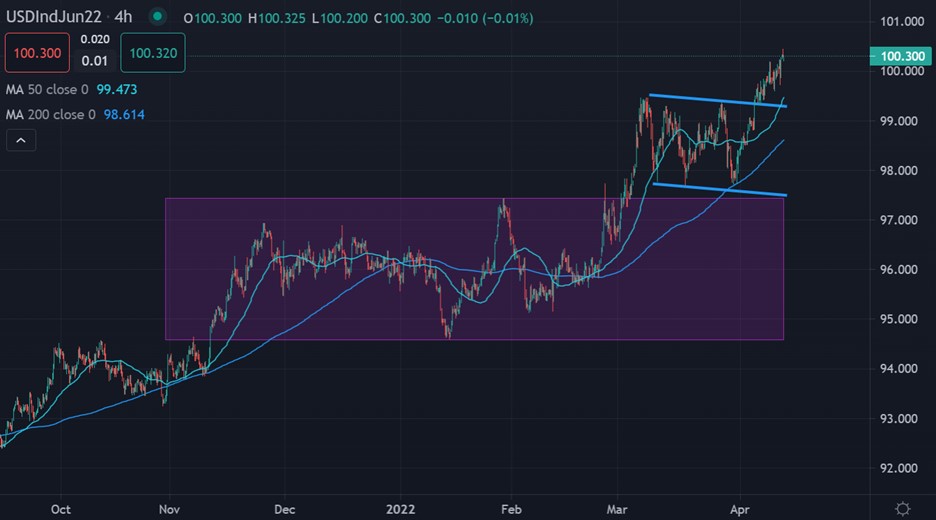
US dollar index Short-Term Technical Analysis
Technical analysis on the four-hour time frame shows that the US dollar index pair has reached the overall target of an invalidated a large head and shoulders pattern and has also ignited a bullish flag pattern.
According to the overall size of the bullish flag pattern it shows that the US dollar index could be preparing to stage a move towards the 101.00 resistance area.
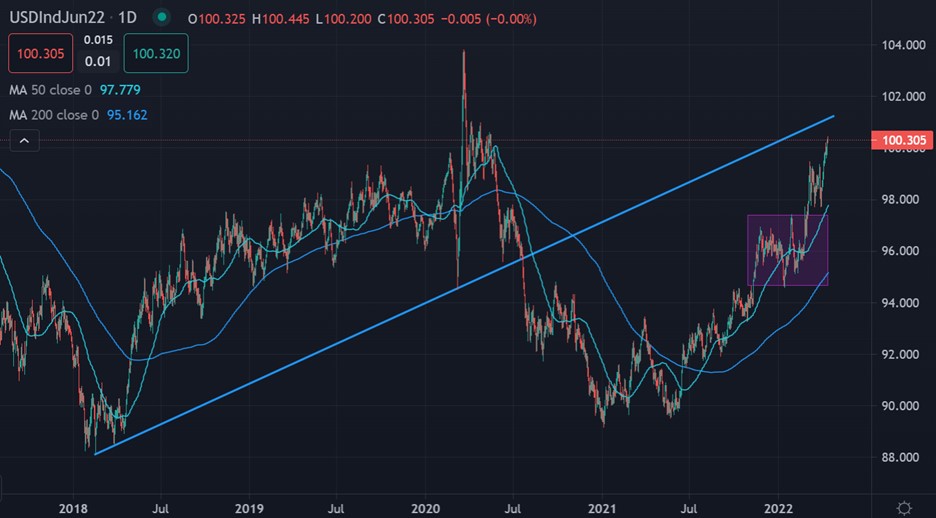
The daily time frame is showing that a bullish golden cross is underway, which was a key bullish breakout signal from earlier this year. The signal is still pointing to more gains ahead.
A test towards a multi-year trendline resistance, around the 101.50 area seems to be on the cards. A break above the trendline would cause more strong gains, while a rejection could see a raft of profit taking in the US dollar index.


