fbpx
High Leverage FX
  • Home
  • Market News
    • All
    • Economy
    • Forex
    • Markets
    • Opinion
    • Politics
    • Tech
    • World
    Asian equities could take a boost after strong gains seen on US equities

    Asian equities may trade on the back foot as traders took profits during Wall Street session

    USDMYR Technical Analysis

    USDMYR Technical Analysis

    Asian equities observe positive start as optimism on Wall Street echoes

    Asian equities could trade with negative bias reflecting caution awaiting Nvidia’s earnings report

    Asian equities could take a boost after strong gains seen on US equities

    Asian equities likely to trade within narrow range following volatile session on Wall Street

    Asian markets may experience volatility as global participants eagerly await significant upcoming events

    Asian markets may experience volatility as global participants eagerly await significant upcoming events

  • Economic Calendar
  • About Us
  • Trading Signals
  • Free Demo Account
High Leverage FX
No Result
View All Result
Home Market News Forex

Gold Technical Analysis – How long can the correction go?

Nathan Batchelor by Nathan Batchelor
March 29, 2022
in Forex
Reading Time: 3 mins read
0
Gold Technical Analysis – How long can the correction go?
427
SHARES
12.1k
VIEWS
Share on FacebookShare on Twitter

Gold is starting to move back towards the $1,900 support level after a false upside move towards the $1,950 last week, which can be categorized as a failed attempt to regain the $2,000 level.

The yellow metal may need to go much lower before it starts to head higher again in order attract strong buying interest for another key technical test of the psychological $2,000 level.

Perhaps the clue to where gold heads next is found on the price chart, and the former key breakout zone where gold first starting to ramp higher towards its recent multi-month high, at $2,060.

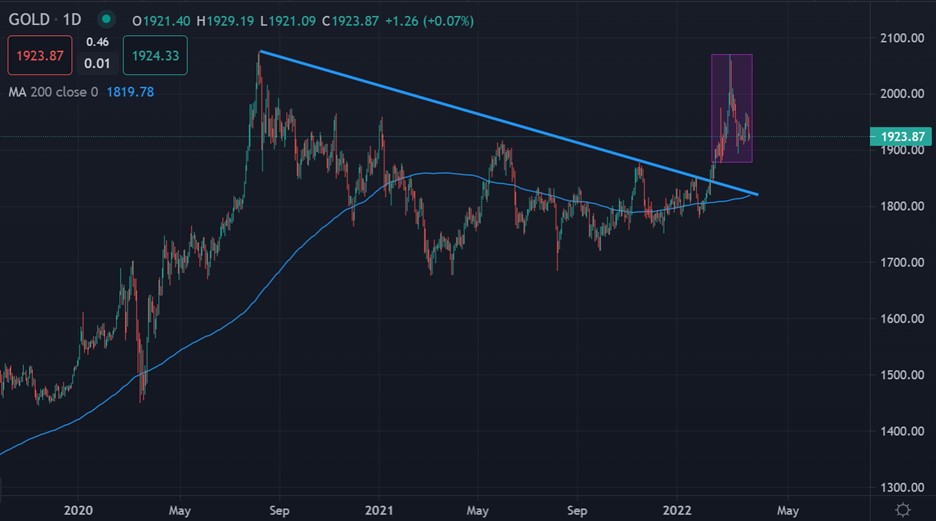
Looking at the daily chart, the key breakout zone this year was located around the $1,810 level. This is also the location of the yellow metals trend defining 200-day moving average.

After key breakouts we often see the asset class in question return to the scene of the break, or the scene of the crime. In trading we typically call this a key technical retest. This is what we could see with gold.

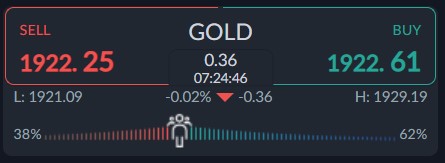
Current sentiment metric towards gold show that traders are becoming less bullish towards gold. The ActivTrader market sentiment tool shows that only 62 percent of traders are bullish towards gold.          

While this is a minor sentiment drop, it is slightly bullish for gold price that after retail are feeling less bullish towards gold prices. Therefore, we may see a negative sentiment starting to emerge of this continues.

For me, the current sentiment bias towards gold suggest that gold can still fall somewhat, as the retail crowd may eventually flip to wholesale bearish if gold corrects lower.

Gold short-term Technical Analysis

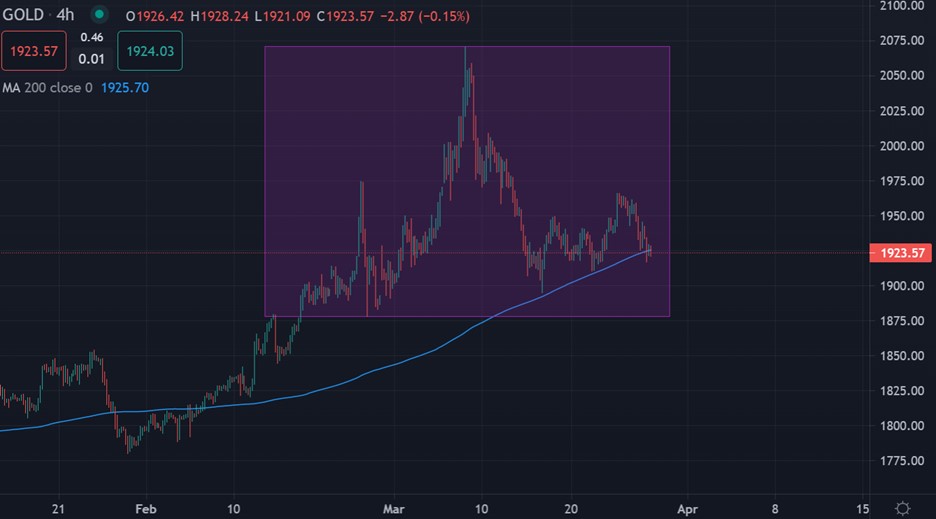
The short-term technicals for the yellow-metal show that a large head and shoulders pattern has been formed, which is technically worrying, but not conclusive on the bear front by any means.

Looking at the four-hour price chart, the Ichimoku indicator shows that gold is moving through thick cloud resistance. I suggest keeping a close eye on the $1,923 area in the short-term.

See real-time quotes provided by our partner.

Gold Medium-term Technical Analysis

The Ichimoku indicator on the daily chart shows that gold remains a strong buy while trading above the $1,810 level, which is critical trendline support and must defend area.

With the bullish breakout above the trendline underway we could easily see gold price tackling $2,000 again. Bulls may need to this area tested before gold starts to rally again.

See real-time quotes provided by our partner.

Tags: Gold
Previous Post

Tesla is a $1 trillion company again

Next Post

Better Web based casinos 2022 mine slot Incentives, Payment Tips & Faqs

Nathan Batchelor

Nathan Batchelor

Related Posts

USDMYR Technical Analysis
Forex

USDMYR Technical Analysis

May 23, 2024
USD/MYR Technical Analysis
Forex

USDMYR Technical Analysis

May 17, 2024
USDMYR Technical Analysis
Forex

USDMYR Technical Analysis

May 15, 2024
USDMYR Technical Analysis
Forex

USDMYR Technical Analysis

May 9, 2024
USDMYR Technical Analysis
Forex

USDMYR Technical Analysis

May 8, 2024
Forex Technical Analysis – Malaysian Ringgit
Forex

USDMYR Technical Analysis

May 7, 2024
Next Post

Better Web based casinos 2022 mine slot Incentives, Payment Tips & Faqs

Leave a Reply Cancel reply

Your email address will not be published. Required fields are marked *


Market Overview

Categories

  • Economy
  • Forex
  • Gadget
  • Markets
  • Opinion
  • Politics
  • RSS Feed
  • Startup
  • Tech
  • Trading Signals
  • Uncategorized
  • World

Site Navigation

  • Home
  • Market News
  • Economic Calendar
  • About Us
  • Trading Signals
  • Free Demo Account
  • Home
  • Market News
  • Economic Calendar
  • About Us
  • Trading Signals
  • Free Demo Account

© 2019 High Leverage FX - All Rights Reserved.

No Result
View All Result
  • Home
  • Market News
    • Forex
    • Economy
    • Opinion
    • World
    • Markets
    • Politics
  • Economic Calendar
  • Trading Signals
  • About Us
  • Free Demo Account
[gtranslate]

© 2019 High Leverage FX - All Rights Reserved.